Article Text

Abstract
Background and purpose Intracerebral haemorrhage volume (ICHV) is prognostically important but does not account for intracranial volume (ICV) and cerebral parenchymal volume (CPV). We assessed measures of intracranial compartments in acute ICH using computerised tomography scans and whether ICHV/ICV and ICHV/CPV predict functional outcomes. We also assessed if cistern effacement, midline shift, old infarcts, leukoaraiosis and brain atrophy were associated with outcomes.
Methods Data from 133 participants from the Rapid Intervention with Glyceryl Trinitrate in Hypertensive Stroke-2 Trial trial were analysed. Measures included ICHV (using ABC/2) and ICV (XYZ/2) (by independent observers); ICHV, ICV and CPV (semiautomated segmentation, SAS); atrophy (intercaudate distance, ICD, Sylvian fissure ratio, SFR); midline shift; leukoaraiosis and cistern effacement (visual assessment). The effects of these measures on death at day 4 and poor functional outcome at day 90 (modified Rankin scale, mRS of >3) was assessed.
Results ICV was significantly different between XYZ and SAS: mean (SD) of 1357 (219) vs 1420 (196), mean difference (MD) 62 mL (p<0.001). There was no significant difference in ICHV between ABC/2 and SAS. There was very good agreement for ICV measured by SAS, CPV, ICD, SFR, leukoaraiosis and cistern score (all interclass correlations, n=10: interobserver 0.72-0.99, intraobserver 0.73-1.00). ICHV/ICV and ICHV/CPV were significantly associated with mRS at day 90, death at day 4 and acute neurological deterioration (all p<0.05), similar to ICHV. Midline shift and cistern effacement at baseline were associated with poor functional outcome but old infarcts, leukoaraiosis and brain atrophy were not.
Conclusions Intracranial compartment measures and visual estimates are reproducible. ICHV adjusted for ICH and CPV could be useful to prognosticate in acute stroke. The presence of midline shift and cistern effacement may predict outcome but the mechanisms need validation in larger studies.
- Stroke
- Hemorrhage
- CT
- Clinical Trial
Data availability statement
All data relevant to the study are included in the article or uploaded as online supplemental information.
This is an open access article distributed in accordance with the Creative Commons Attribution Non Commercial (CC BY-NC 4.0) license, which permits others to distribute, remix, adapt, build upon this work non-commercially, and license their derivative works on different terms, provided the original work is properly cited, appropriate credit is given, any changes made indicated, and the use is non-commercial. See: http://creativecommons.org/licenses/by-nc/4.0/.
Statistics from Altmetric.com
WHAT IS ALREADY KNOWN ON THIS TOPIC
Intracerebral haemorrhage volume is prognostically important but it is unclear whether adjustment for intracranial volume and cerebral parenchymal volume predict functional outcomes.
WHAT THIS STUDY ADDS
Simple approximations and semiautomated computational methods to assess intracranial volume, cerebral parenchymal volume and cerebrospinal fluid and visual estimates of leucoaraiosis and mass effect in acute intracerebral haemorrhage are reproducible.
Estimating intracranial volume and cerebral parenchymal volume along with haematoma volume and measures of midline shift and visual assessment of cistern effacement could be useful to prognosticate in emergency settings.
HOW THIS STUDY MIGHT AFFECT RESEARCH, PRACTICE AND/OR POLICY
The results could be useful to plan treatment, prognosticate stratify patients into future randomised controlled trials and understand pathophysiological changes in the brain using CT scans, which are widely available and inexpensive imaging resource.
Background and purpose
Non-contrast CT scanning is the mainstay for diagnosing intracerebral haemorrhage (ICH) and is cost-effective, readily available and tolerated by unwell patients. CT is also increasingly used as a research tool in acute stroke allowing assessment of haematoma size, location, signs of ongoing bleeding and intraventricular haemorrhage.1–3 Although these factors reflect the severity and consequence of the presenting haemorrhage, outcomes could be affected by the volume of intracranial compartments and structure of the brain in which the haemorrhage occurs.
Observational studies suggest that smaller cerebral parenchymal and intracranial volume (ICV) is strongly associated with increased risk of death or disability in patients with cerebrovascular disease and dementia.4–6 Nitkutan et al found that cerebral parenchymal volume (CPV) was reduced in acute lacunar stroke and associated with poor cognition at 1 year.7
Hypertension, cerebral amyloid angiopathy and leukoaraiosis are known causes of haemorrhagic stroke but little is known on how these individually or combined, affect the volume of the intracranial compartments in acute ICH. This would be relevant as increased space from brain loss may allow greater haemorrhage expansion before decompensation. Moreover, acute hydrocephalus is a common complication8 and patients with haematomas in the thalamus or close to the ventricles are more likely to need emergency surgery for ventricular drainage.9 Hence, measures of ICV and CPV could be useful to prognosticate in acute stroke and outcome measures of randomised clinical trials testing potential treatments. Furthermore, assessing signs of raised intracranial pressure or mass effect such as cistern effacement and midline shift on a CT could help to plan treatment or understand pathophysiological changes in the brain. With systematic collection of patient data (eg, death, neurological deterioration) and availability of data linkage in clinical trials, there is enormous potential for the large numbers of CT scans performed to test the utility of these measures in acute ICH.
ICV can be measured on a CT using the XYZ/2 method, which approximates ICV as a sphere10 or computer-assisted semiautomated segmentation methods (SAS).11 12 Similarly, the cerebral parenchymalvolume (CPV) can be determined using the SAS method.11 Additionally, features of small vessel disease, SVD (leukoaraiosis, old infarcts/lacunes) and brain atrophy can be visually assessed and rated semi-quantitatively.13 14 CT scan assessment of SVD and brain atrophy are in development although lag well behind those developed for MRI. The advantages and disadvantages of these approaches reflect the balance between measurement time, availability of computer workstations, type of data required and variation in patient follow-up. Moreover, little is known about the reliability of these measures in acute ICH where clinicians often make decisions in urgent situations.
Here, we report the accuracy and reliability of measures of intracranial compartments including ICV and CPV in acute ICH, compared approximations vs computer-assisted segmentation assessments and tested the relationship with functional outcomes. We also examined the reproducibility of measures of brain atrophy, leukoaraiosis (semiquantitative visual assessment), and hypothesised that these along with signs of raised intracranial pressure (effacement of ambient cisterns and midline shift) are associated with poor functional outcome at day 90, early death and acute neurological deterioration.
Materials and methods
Participants
We used anonymised CT scans of participants recruited to the Rapid Intervention with Glyceryl Trinitrate in Hypertensive Stroke-2 Trial (RIGHT-2). RIGHT-2 was a prospective, multicentre, paramedic-delivered, randomised, sham-controlled, blinded-endpoint phase 3 trial which tested blood pressure (BP) lowering in ICH using glyceryl trinitrate (GTN) patches and all patients underwent CT scanning at hospital admission in the acute phase of their illness. The trial protocol and results have been published.15 16 RIGHT-2 had regulatory and ethics approvals (REC number:15/EM/0055) in each participating hospital and all patients gave written consent, or a relative provided proxy consent if the patient lacked capacity. In brief, 1149 patients with presumed stroke, fast-arm-speech-time (FAST) score of 2 or 3 and systolic BP 120 mm Hg or higher were included within 4 hours of onset and randomised (1:1) to transdermal GTN, a nitric oxide donor or a similar sham dressing. Of these, 145 participants had ICH. The first treatment (GTN or sham) was administered by the paramedic immediately in the ambulance, and continued for <3 days. Patients from a nursing home, reduced consciousness (Glasgow Coma Scale (GCS) <8/15), hypoglycaemia (capillary glucose <2.5 mmol/L) or witnessed seizure were excluded.
Imaging assessment
For the present analysis, we included 133 CT brain scans performed on admission to hospital and collected for central adjudication. Scans of 12 other participants were not readable, hence excluded. Of the 133 participants, 80 had a follow-up CT scan at 24 hours to assess for haemorrhage expansion and these were included. Images were adjudicated by a panel of expert neuroradiologists masked to treatment assignment and symptoms using assessments updated from Third International Stroke Trial and Efficacy of Nitric Oxide in Stroke Trial.17 18 Collected information included whether the participant had a haemorrhage, and if so an estimate of its maximal diameter (using an ordered categorical assessment of its longest axis: <3, 3–4.9, 5–8, >8 cm19 20 and the presence of other findings (mass effect, atrophy, old infarcts, leukoaraiosis).
Scans were visualised and analysed using ITK-SNAP software V.3.6 (www.itksnap.org) on a 26 inch Apple iMAC. Two authors (KK and ZKL) measured ICH volume (ICHV) using the ABC/221 and the SAS methods.22 Haemorrhage expansion was defined as an increase in volume of >6 mL or >33% from baseline volume.22
The same authors computed ICV by the XYZ/2 method.10 The XYZ/2 method requires measuring the largest anteroposterior axial diameter of the supratentorial brain (‘X’), the longest diameter to ‘X’ at 90° in the axial plane (‘Y’) and Z is the product of slice thickness multiplied by the number of slices from the foramen magnum to inner skull table at the vertex.10 For SAS of ICV, the region of interest was identified using segmentation parameters previously defined.11 An upper threshold of attenuation of 200 Hounsfield units (HU) or higher was set to exclude cranial bones11 and the volume of the region including cerebral hemispheres, cerebellum and brain stem until the foramen magnum was computed to obtain the ICV (online supplemental appendix, figure 1).
Supplemental material
For CPV, upper and lower thresholds (usually 23 to 100 HU) were established by segmenting the brain parenchyma within the ICV and edited manually to exclude haemorrhage volume (online supplemental appendix, figure 2).11
The volume of cerebrospinal fluid (CSF) was calculated by subtracting the difference between ICV and CPV.11
Midline shift was measured as the distance between the septum pellucidum to the ‘ideal midline’, which was a line drawn between the anterior-most point of anterior falx and the posterior-most point of posterior falx. (online supplemental appendix, figure 3)
The cistern score was assessed using the methods by Diringer et al.8 A score of 0 was given if the ambient cisterns appeared normal. A score of 1 was assigned if the cistern appeared effaced and two if completely obliterated. The score for each cistern was then added to give a total score of 4.8
Visual rating of leukoaraiosis on CT was performed separately for the regions anterior and posterior to the central sulcus according to van Swieten13: 0: no lesion; 1: partly involving the white matter; 2: extending up to the subcortex. The two scores were added for both regions to give a maximum score of 4 (online supplemental appendix, figure 4).
For atrophy, the intercaudate distance (ICD), Sylvian fissure ratio (SFR) and the ratio of CPV/ICV calculated.23 24 ICD is the shortest length between the medial border of the caudate indentation at the level of frontal horns of the lateral ventricles. The SFR was calculated as the average of the maximum width of the Sylvian fissures on the slice showing them at their widest divided by the transpineal coronal inner table diameter (online supplemental appendix).23 Where the presence of haematoma obscured measurement of ICD, the minimum distance between the caudate nuclei on the unaffected side and the septum pellucidum was obtained and then multiplied by 2.23 Similarly, the maximum width of Sylvian fissure on the unaffected hemisphere was used to compute the SFR.
The two authors assessed baseline scans blinded to each other’s data and repeated a proportion of the same scans (n=10) at a different time blinded to their own measurements. All measurements and visual assessments were performed blinded to clinical information and treatment assignment.
Clinical outcomes
Participants were assessed at day 4 for acute neurological deterioration which was defined as an increase in National Institutes of Health Stroke Scale (NIHSS) of ≥4 or a decrease in GCS of ≥2.25 Information about death was collected during the first 4 days. In RIGHT-2, an mRS score >3 was defined as poor functional outcome. This was recorded centrally by telephone by a trained assessor blinded to treatment allocation. All predictions of outcomes were based on 133 baseline CT scans with the exception of haemorrhage expansion, which was based on 80 patients who had baseline and follow-up CT scans.
Statistical analysis
Data are shown as number (%), mean (SD) or median (IQR). Measurement of intraobserver and interobserver variability was assessed using the intraclass correlation coefficient (ICC).26
Binary logistic regression adjusting for baseline variables was used to compare the ratio of ICHV/ICV and ICHV/CPV on day 4 death, acute neurological deterioration, day 90 poor functional outcome. Similarly, the effects of midline shift, cistern effacement, old infarcts, leukoaraiosis and brain atrophy was also assessed. A two-tailed p<0.05 was considered statistically significant. Analyses were performed using SPSS V.27 (IBM).
Results
Patient demographic and clinical details are shown in table 1. The mean age of 133 patients in this analysis was 73 years (SD 13.1), 55% were male and the prerandomisation mean BP was 175.5 (27.7) mm Hg. The majority of patients had a FAST score 3 and the median NIHSS score was 16. Most haematomas were in the middle cerebral artery territory and the majority of participants had leukoaraiosis, old infarcts and brain atrophy on their scans. When adjudicated by experts, hydrocephalus was present in 44% of participants and 41% had haemorrhage extending into the ventricles (table 1). Leukoaraiosis was seen in >50% of patients and the median van Swieten score was 2. When measured by SAS, the mean haemorrhage volume was 37.7 mL, mean ICV was 1419.6 mL and the mean CPV was 1182 mL. The calculated CSF volume was 240.6 mL and about a quarter of patients had midline shift of >5 mm (table 1).
Baseline characteristics
Intracranial volume
ICV was significantly different between XYZ/2 estimate method and SAS: (mean) 1357.3 SD (218.9), 1419.6 (196.3) mL, respectively (online supplemental table I). The ICV was larger by an average of 62.2 mL with SAS compared with XYZ/2, a difference of 4.5% of the mean ICV measured by the two methods. The Bland-Altman analysis showed that the difference between the two measures increased with increasing ICV and the slope of the best-fit regression line between XYZ/2 and SAS was 0.12 (online supplemental figure I). There was very good interobserver agreement (ICC) for measurement of ICV by SAS (online supplemental table II).
Supplemental material
When comparing each observer’s ICV with the same observer’s measurement by SAS, the ICC was excellent 0.95–0.99 (online supplemental table III).
Intracerebral haemorrhage volume
There was no significant difference in ICH volume (ICHV) measured by ABC/2 and by SAS (online supplemental table I), (online supplemental figure II). There was significant correlation between the two methods (r2=0.79, p<0.001).
ICHV/ICV ratio using ABC/XYZ was similar to SAS (3.4 (3.0) % vs 2.6 (2.7)%) and there was strong correlation (r2=0.97, p<0.001). (online supplemental figure III).
Cerebral parenchymal volume
The mean CPV (excluding ICHV) was 1182.1 (SD 197.3) mL representing 83.5 (9.6)% of ICV. Including the ICH volume as part of the ‘solid tissue’ comprising brain and ICH volume (1219.8 mL (SD 208.7)) represented 86.1 (10.5)% of the ICV.
The interobserver and intraobserver agreement was very good for CPV calculated using SAS: interobserver ICC 0.92 (online supplemental table II) and the intraobserver ICC varied between 0.92 and 0.98 (online supplemental table III).
CSF volume
The baseline CSF volume was 240.6 (154.1) mL representing 16.7 (10.09)% of ICV. There was good inter and intraobserver agreement for measurement of CSF volume assessed on 10 CT scans (online supplemental table II and online supplemental table III)
ICD, Sylvian fissure ratio
The interobserver ICC for measures of atrophy including ICD, SFR was 0.69 and 0.72, respectively (online supplemental table II). When comparing each observer’s measurement of ICD with the same observers repeated measure, the ICC ranged from 0.83 to 0.95 and for SFR the ICC was 0.73–0.92 indicating substantial agreement (online supplemental table III).
Cistern effacement
Interobserver and intraobserver agreements was very good for visual assessment of mass effect using the ambient cistern scores: interobserver ICC 0.94 and intraobserver ICC 0.96–1.00 (online supplemental table IV).
Visual assessment of leukoaraiosis
There was very good interobserver and intraobserver agreement for visual assessments of leukoaraiosis: interobserver ICC 0.98 and intraobserver ranging between 0.83 and 0.95) (online supplemental table IV).
Clinical outcomes
At day 4, 36 (27.1%) participants were to recorded to have acute neurological deterioration and 24 (18%) participants had died. At day 90, death was reported in 51 (38.3%) participants and the majority (70.7%) had mRS>3.
Relationships between ICHV, ICHV/ICV and ICHV/CPV with clinical outcomes
After adjusting for baseline characteristics, ICHV was significantly associated with mRS at day 90, early death and acute neurological deterioration (table 2). After adjusting for ICV by SAS, ICHV/ICV was significantly associated with acute neurological deterioration (adjusted OR (aOR) 1.40; 95% CI 1.11 to 1.78), early death (aOR 1.24; 95% CI 1.06 to 1.47) and mRS at day 90 (aOR 1.79; 95% CI 1.24 to 2.59) (table 2). Similar results were observed for the ICHV by ABC/2 and ICHV/ICV by ABC/XYZ (data not shown).
The effects of baseline ICH volume (ICHV), ICH volume as a ratio of ICV (ICHV/ICV), ICH volume as a ratio of CPV (ICHV/CPV) (all measured by SAS), midline shift and cistern effacement on day 90 mRS, day 4 death and acute neurological deterioration
ICHV/ICV by SAS and approximation and ICHV/CPV had similar accuracy (area under the receiver operating characteristics curve, all AUROC 0.83) compared with ICHV in predicting early death, acute neurological deterioration and poor functional outcome (AUROC 0.84, 0.86 and 0.85, respectively) (figure 1).

Receiver operating characteristic (ROC) analysis for day 90 modified Rankin scale of >3, day 4 death and acute neurological deterioration. Similar area under the curves was observed for ICH volume (ICHV) (semiautomated segmentation and ABC/2), ICH volume/ICV ratio (semiautomated segmentation and ABC/XYZ) and ICH volume/CPV ratio (semiautomated segmentation). AUROC, area under the receiver operating characteristics curve; CPV, cerebral parenchymal volume; ICH, intracerebral haemorrhage; ICV, intracranial volume; SAS, semiautomated segmentation.
The optimal threshold of ICHV which predicted early death, acute neurological deterioration and mRS >3 at day 90 was 48 mL, 31 mL and 35 mL, respectively (figure 1).
Relationship between cistern effacement and midline shift and outcomes
After adjustment for baseline characteristics, there was a significant relationship between effacement of ambient cisterns with acute neurological deterioration, death at day 4 and mRS at day 90. Similarly, midline shift was significantly associated with early death (aOR 1.17, 95% CI 1.04 to 1.31) acute neurological deterioration (aOR 1.36; 95% CI 1.06 to 1.73) and mRS at day 90 (aOR 1.46; 95% CI 1.11 to 1.93) (table 3).
The relationships between midline shift, cistern effacement, small vessel disease (old infarcts, van Swieten score) and measures of brain atrophy with MRS at day 90, death at day 4 and acute neurological deterioration
For severity of ambient cistern effacement, the area under the curve for early death, acute neurological deterioration and day 90 mRS >3 was 0.90, 0.87 and 0.80, respectively (figure 2). For midline shift, the accuracy was 0.83, 0.86 and 0.84 for early death, acute neurological deterioration and mRS at day 90, respectively.

Receiver operating characteristic (ROC) analysis of ambient cistern score and midline shift for day 90 modified Rankin scale of >3, day 4 death and acute neurological deterioration. Ambient Cistern Score had slightly better accuracy than midline shift for prediction of day 4 death and neurological deterioration while midline shift was marginally better in predicting day 90 modified Rankin scale of >3. AUROC, area under the receiver operating characteristics curve.
Analysis showed that an ambient cistern effacement score of 1 predicted early death and mRS >3 at day 90 (figure 2). As for midline shift, a threshold of 6.1 mm predicted early death and a threshold of 4.1 mm predicted acute neurological deterioration. As for mRS, a threshold of 5.6 mm in midline shift predicted mRS >3 at day 90 (figure 2).
Relationship between brain atrophy and markers of small vessel disease and outcomes
After adjusting for baseline factors, there was no significant relationship between markers of SVD (old infarcts and leukoaraiosis) and brain atrophy with early death, acute neurological deterioration and mRS at day 90 (table 3, figure 3).
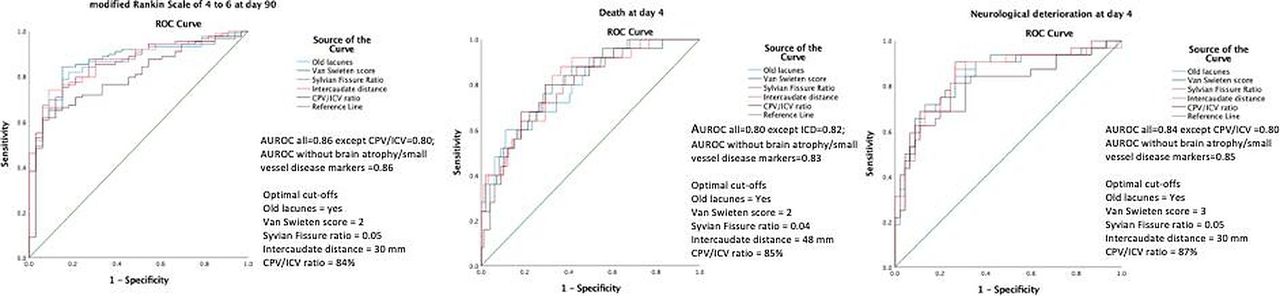
Receiver operating characteristic (ROC) analysis of brain atrophy/small vessel disease markers for day 90 modified Rankin scale of >3, day 4 death and acute neurological deterioration. The addition of brain atrophy/small vessel disease markers to known prognostic factors (age, sex, onset to CT time, treatment with GTN, Glasgow Coma Scale, systolic blood pressure and ICH volume) did not improve the accuracy of outcome prediction. AUROC of models including these prognostic factors but without brain atrophy/small vessel disease markers=0.86, 0.85 and 0.85, respectively, for day 90 modified Rankin scale of >3, day 4 death and acute neurological deterioration, which was not very different from those with brain atrophy/small vessel disease markers. AUROC, area under the receiver operating characteristics curve; CPV, cerebral parenchymal volume; GTN, glyceryl trinitrate; ICH, intracerebral haemorrhage; ICV, intracranial volume.
Relationship between ICHV/ICV and ICHV/CPV and haemorrhage expansion
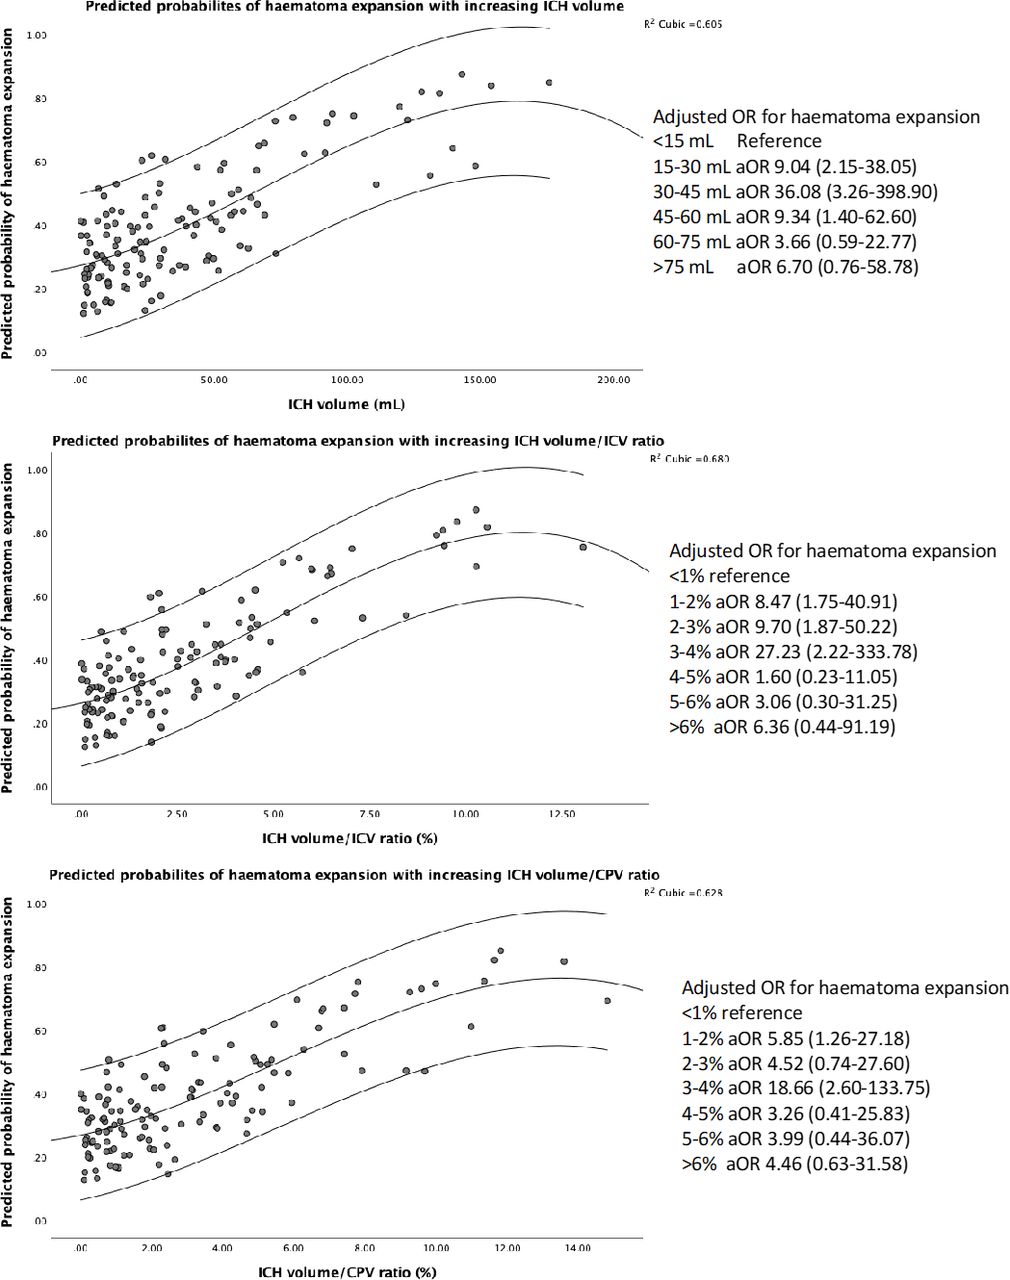
Of the 80 participants who had a follow-up CT scan, 29 (21.8%) were assessed to have haemorrhage expansion at 24 hours. The risk of haemorrhage expansion (compared with no expansion) increased with larger ICH volumes at baseline (37.3 (25.5) vs 23.8 (25.52) mL), higher ICHV/ICV (2.6% (1.8%) vs 1.6% (1.7%)) and ICHV/CPV ratio (3.0% (2.1%) vs 2.0% (2.0%)) (figure 4). When assessed by haemorrhage size, the risk of expansion increased up to 60 mL which corresponded to ICHV/ICV and ICHV/CPV of 3%–4%, respectively (figure 4). This could be relevant as higher ratios are associated with poor prognosis.27
Scatterplot showing predicted probabilities of haemorrhage expansion with increasing ICHV, ICHV/ICV and ICHV/CPV. The risk of haemorrhage expansion increased with larger ICH volumes but plateaued at 60 mL, when the risk is no longer significant. similar observations were seen with ICH volume/ICV and ICH volume/CPV ratios at cut-offs of >4%. *Models were adjusted for systolic blood pressure, time from stroke onset-to-CT scan and treatment with GTN. CPV, cerebral parenchymal volume; GTN, glyceryl trinitrate; ICHV, intracerebral haemorrhage volume; ICV, intracranial volume.
Relationship between haemorrhage expansion and functional outcome at day 90
After adjusting for baseline variables including ICHV, haemorrhage expansion was not associated with poor functional outcome at day 90 (aOR 0.68; 95% CI 0.20 to 2.28).
Discussion
This study compared simple approximations and semi-automated computational methods to assess various intracranial compartments including ICV, CPV and CSF and visual estimates of leukoaraiosis and mass effect using CT scans of patients recruited within 4 hours of ictus and showed that the measures are reproducible. The ratio of haemorrhage volume and ICV has been examined10 28 but, to our knowledge, this is the first study to assess the relationships with outcomes in adult acute ICH. Importantly, the ratio of baseline haemorrhage volume and ICV was significantly associated with poor functional outcome at day 90, death at day 4 and acute neurological deterioration. We extended our hypothesis and found similar results with the ratio of haemorrhage volume and CPV. One explanation for the results is that brain volume decreases with age so older patients are unable to compensate in acute stroke.28 29 It is possible that cerebral parenchymal ICHV reflects subclinical vasculopathy and structural changes such as white matter degeneration, from hypertension, amyloid angiopathy or leukoaraiosis.30–32 Each of these, combined or independently are associated with chronic ischaemia, thinning of the brain and reduced volumes.33 34 So, it may be postulated that such changes cause extensive bleeding and increase the risk of rebleeding, haemorrhage expansion and poor outcome.
We examined two methods to measure ICV: XYZ/2 and semi-automatic segmentation. The XYZ/2 method is one of the most common methods and thus estimation of ICV can be done at the bedside in about a minute. Although ICV measured by XYZ/2 and SAS were strongly correlated (r2=0.79), the latter measures were higher by 62 mL. One explanation for this difference is that the longest antero-posterior diameter (X) was measured in the axial plane and this may not be the largest diameter of the supratentorial brain. Second, XYZ/2 approximates the ICV as a sphere which may not appropriate with the skull having various bony ridges and fossae.
Although this study shows that measures of ICV and parenchymal volume using SAS on CT are reliable, the process was time-consuming and on occasions, technically challenging. For example, it was difficult to identify brain from extraventricular CSF because of artefact by calvarial bone or contrast resolution particularly where the patient had moved and the scan was degraded by movement artefact. However, in this situation, it was still possible to measure the X and Y distance. On occasions, the outermost limits of the ventricles on some image slices were less defined which could reflect regional age-related changes in structure of the brain and variation.35 36 On other instances, it was difficult to set a segmentation parameter for parenchyma that was close to a bone or ventricles during acute hydrocephalus. The threshold method will not take into account ICH associated oedema so the volume may be much larger than the measured area. Although it was possible to manually edit segmentation parameters, any adjustment was subjective. Last, segmentation of intracranial and CPV require advanced software and may be difficult to perform routinely at the bedside. Although we did not formally time the different measurement methods, both authors found measuring the ICV and CPV by the SAS method very time consuming in comparison to approximations.
The interobserver agreement of ICD and SFR was 0.69 and 0.72, respectively, and there are few potential explanations for this variation. For example, the presence of haemorrhage obscured measurement in the affected hemisphere. On occasions, there was significant collapse of the contralateral ventricle and/or Sylvian fissure or the structure was deformed from midline shift. The problem was compounded by the presence of subarachnoid blood or significant oedema. Although the scans were identical for each author, in such instances, the authors will have chosen different slices or window settings. It is suggested that brain atrophy can be measured using SAS methods37–39 but whether these can be easily performed using simple-measurement tools with standard image-viewing software in emergency settings need further exploration.
The receiver operator characteristics curve analysis found that the ratio of ICHV/ICV and ICHV/CPV had similar accuracy compared with ICHV as predictors of poor outcome using SAS. From a pathophysiological view, this can be explained because the intracranial and parenchymal volume reserve will need to be first exhausted by the presenting haemorrhage and accompanying oedema before causing significant midline shift and brain herniation.
Large ICHV at baseline are at increased risk of haemorrhage expansion40 41 and in this study, this was at highest at 30–45 mL. It is suggested that a large haemorrhage indicates multiple bleeding areas within itself and this in turn induces more bleeding by shearing the surrounding arteries and arterioles.42 Haemorrhage expansion is already strongly linked to ICHV which could explain the additional lack of association with poor functional outcome at day 90.40 41 Another reason could be that this analysis was based on only 80 patients with a baseline and follow-up CT scan.
Brain imaging markers of SVD (old infarcts, leukoaraiosis) and atrophy are associated with poor outcomes in ICH37 43 but one study in moderate volume basal ganglia haemorrhages concluded that atrophy was protective by increasing brain reserve.23 We found no significant association with acute neurological deterioration, early death, death or dependence at day 90. The reasons for our findings probably relate to the small number of patients with ICH or large ICHV at baseline such that poor outcomes occurred irrespective of background changes associated with old age and brain frailty.
This research has several strengths including the use of independent assessors, multiple methods for assessing ICV compartments and a large dataset. To minimise measurement error, the authors, were trained and experienced in using ITK-SNAP software. The accuracy and reliability of measurements was assessed for both interobserver and intraobserver variation. The dataset included patients from various hospitals in the UK, so the findings are externally valid.
Our study has four significant limitations. First, the data come from a randomised controlled trial in acute stroke so may represent a selected population. Trial criteria excluded patients with low BP and reduced consciousness (GCS <8/15). As a result, patients with a very large haematoma were likely to have been underrepresented. Second, the mean age of participants was 73 years so the results may not represent older populations with brain frailty more likely to be prevalent.
Third, approximately 80% of the haemorrhages were in the middle cerebral artery territory so the results do not represent a population where posterior fossa haemorrhages are more common. Last, there was lack of direct measures of intracranial pressure and brain perfusion (such as transcranial Doppler) so the prognostic effects were not assessed in this study.
In conclusion, we found that volumes of ICH, brain and intracranial compartments by computational and visual estimates in patients are reproducible. The results could be useful to plan treatment, stratify patients into future trials or understand pathophysiological changes in the brain using CT scans, which are widely available and inexpensive imaging resource. This study also found that estimating ICV and CPV along with haematoma volume, could be useful to prognosticate in emergency settings. In addition, we found that measures of midline shift and visual assessment of cistern effacement predict outcomes but the mechanisms need further exploration. However, no parameter was superior to another in predicting outcomes. This study found that old infarcts, measures of brain atrophy and estimates of small vessel disease at baseline did not predict prognosis.
To a clinician making quick and critical decisions about a haemorrhagic stroke patient by the bedside, an ideal method is one that gives a rapid estimate of ICV. Calculating ABC/ XYZ can be performed rapidly using simple measurement tools and potentially implemented even in hospitals with limited care resources. Further studies are needed to prospectively validate the results including more patients with larger haemorrhages. This could include comparison during haemorrhage expansion and long-term outcomes.
Data availability statement
All data relevant to the study are included in the article or uploaded as online supplemental information.
Ethics statements
Patient consent for publication
Ethics approval
This study involves human participants and was approved by Ethics approval reference: 15/EM/0055. Participants gave informed consent to participate in the study before taking part.
Acknowledgments
We thank the investigators and patients who participated in RIGHT-2.
References
Supplementary material
Supplementary Data
This web only file has been produced by the BMJ Publishing Group from an electronic file supplied by the author(s) and has not been edited for content.
Footnotes
Contributors The study was conceived by KK with input from ZKL, PMB, NS and RD. Imaging guidance was led by JW. LJW supported with statistical advice. KK wrote and prepared the first draft of the manuscript with input from the writing committee, all of whom approve for the final version to be submitted.
Funding RIGHT-2 (ISRCTN26986053) was funded by the British Heart Foundation (grant number CS/14/4/30972).
Competing interests PMB is Stroke Association Professor of Stroke Medicine and Chief Investigator of RIGHT-2. JW was the neuroimaging lead and supported by the Scottish Funding Council and Chief Scientist Office SINAPSE collaboration (Scottish Imaging Network, A Platform for Scientific Excellence, (http://www.sinapse.ac.uk) and by the UK Dementia Research Institute which receives its funding from the UK Medical Research Council, Alzheimer’s Society and Alzheimer’s Research UK. ZKL acknowledges the National University of Malaysia (GP-2020-K019817) for supporting with a research grant in order to undertake this work.
Provenance and peer review Not commissioned; externally peer reviewed.
Supplemental material This content has been supplied by the author(s). It has not been vetted by BMJ Publishing Group Limited (BMJ) and may not have been peer-reviewed. Any opinions or recommendations discussed are solely those of the author(s) and are not endorsed by BMJ. BMJ disclaims all liability and responsibility arising from any reliance placed on the content. Where the content includes any translated material, BMJ does not warrant the accuracy and reliability of the translations (including but not limited to local regulations, clinical guidelines, terminology, drug names and drug dosages), and is not responsible for any error and/or omissions arising from translation and adaptation or otherwise.