Article Text

Abstract
Background High blood pressure variability (BPV) is a novel risk factor for cardiovascular disease. However, the heterogeneity of systolic blood pressure variability (SBPV) and diastolic blood pressure variability (DBPV) for different vascular events remains unclear. This study aims to investigate whether SBPV or DBPV has different contribution to vascular events in patients with acute ischaemic stroke (IS) or transient ischaemic attack (TIA).
Methods Data from the BOSS (blood pressure and clinical outcome in TIA or IS) study were examined for vascular events at 3-month and 1-year follow-up. BPV was defined as the SD and coefficient of variation (CV) of day-to-day measurements within 3 months after IS/TIA. Vascular events include cardiovascular events (myocardial infarction, unstable angina, cardiac death and congestive heart failure) and cerebrovascular events (ischaemic or haemorrhagic stroke). Logistic regression model was used to test the associations between BPV and vascular events.
Results Of 2325 patients with IS or TIA, 103 (4.43 %) experienced a recurrent stroke and 64 (2.75 %) had cardiovascular events within 3 months. Day-to-day SBPV was only associated with stroke recurrence (BPVSD: OR, 1.72, 95% CI 1.09 to 2.71; BPVCV: 1.86, 95% CI 1.19 to 2.92), but not cardiovascular events (BPVSD: 1.67, 95% CI 0.94 to 2.94; BPVCV: 1.51, 95% CI 0.86 to 2.64). However, DBPV seems to be related to both stroke (BPVSD: 1.60, 95% CI 1.02 to 2.49; BPVCV: 1.53, 95% CI 0.99 to 2.37) and cardiovascular events (BPVSD: 2.48, 95% CI 1.37 to 4.48; BPVCV: 1.92, 95% CI 1.09 to 3.36). Similar results were found at 1 year.
Conclusions For patients with IS/TIA, stroke recurrence was associated with both SBPV and DBPV; however, cardiovascular events seem to be only related to DBPV.
- systolic blood pressure variability
- diastolic blood pressure variability
- stroke
- cardiovascular events
This is an open access article distributed in accordance with the Creative Commons Attribution Non Commercial (CC BY-NC 4.0) license, which permits others to distribute, remix, adapt, build upon this work non-commercially, and license their derivative works on different terms, provided the original work is properly cited, appropriate credit is given, any changes made indicated, and the use is non-commercial. See: http://creativecommons.org/licenses/by-nc/4.0/.
Statistics from Altmetric.com
Introduction
High blood pressure variability (BPV) is a novel risk factor for cardiovascular disease, independent of mean blood pressure (BP).1–3 In 2010, Rothwell and colleagues2 published a comprehensive series of analyses from four studies showing an association between visit-to-visit variability (VVV) of systolic blood pressure (SBP) and vascular events in patients with transient ischaemic attack (TIA); however, variability in diastolic blood pressure (DBP) was not a predictor. Meanwhile, the STABILITY (darapladib vs placebo in patients with established coronary heart disease) trial suggested that, in patients with stable coronary heart disease, higher VVV of both SBP and DBP was a strong predictor of cardiovascular events, but not of stroke.4 Studies on the associations between systolic blood pressure variability (SBPV) and diastolic blood pressure variability (DBPV) with stroke and cardiovascular outcomes have yielded conflicting results. The underlying mechanism leading to this discrepancy remains unclear. Which organ is more vulnerable to the fluctuation of BP: brain or heart? A study from the ARIC (Atherosclerosis Risk In Communities) cohort reported that a DBP <60 mm Hg was associated with incident coronary heart disease and mortality, but not with stroke.5 It is therefore reasonable to hypothesise that SBPV and DBPV may have different contribution to cerebrovascular events and cardiovascular events.
Achieving intensive SBP reductions will inevitably also trigger fluctuation in DBP. With SPRINT (Systolic Blood Pressure Intervention Trial) reporting a beneficial effect of intensive SBP reductions among high-risk adults without diabetes,6 it is requisite to discuss the heterogeneity of SBPV and DBPV for different vascular events. Consequently, the objective of the present study was to examine SBPV or DBPV as a risk factor separately, assessed day to day within 3 months, for cardiovascular and cerebrovascular events in patients with acute ischaemic stroke (IS) or TIA, and to investigate whether SBPV or DBPV has different contribution to vascular events.
Methods
Study design
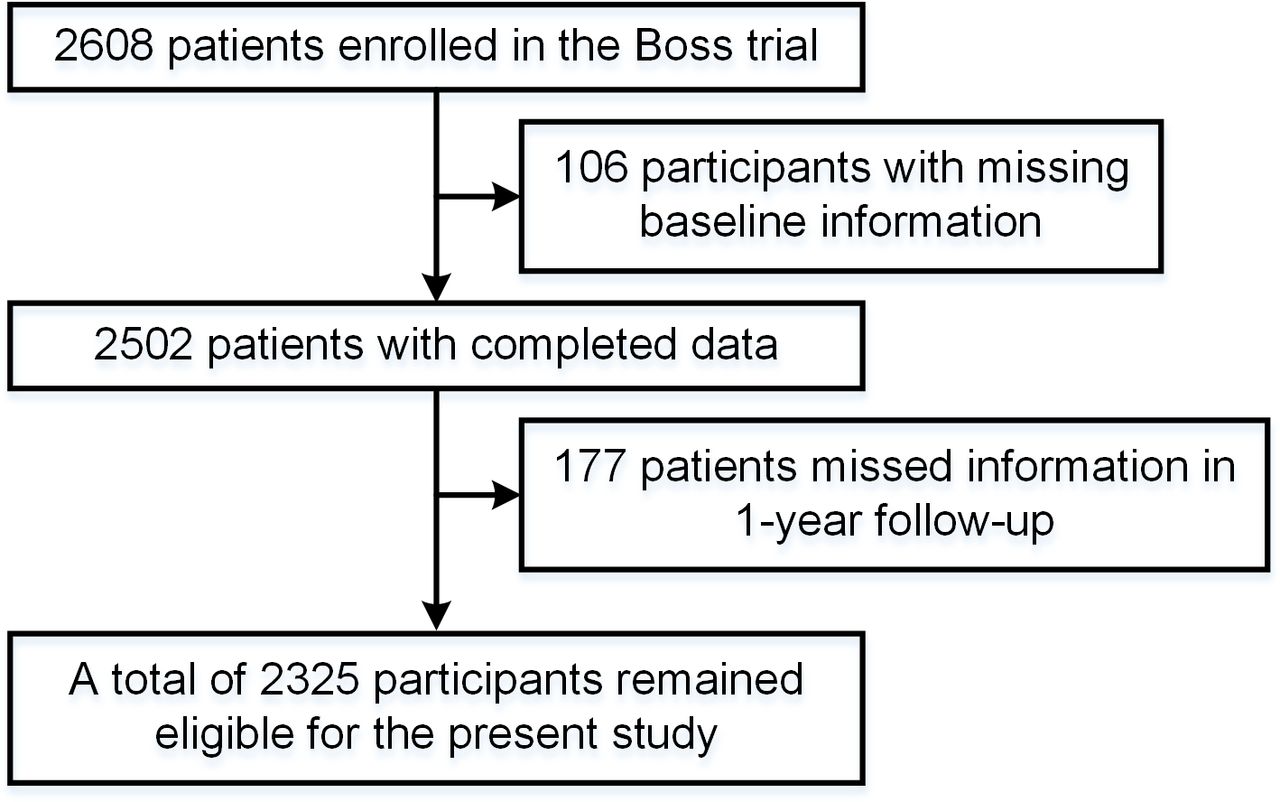
Details of the BOSS study (blood pressure and clinical outcome in TIA or IS), study design, rationale, and baseline characteristics were published elsewhere.7 Briefly, BOSS was a nationwide, hospital-based, longitudinal cohort study that was conducted at 61 hospitals in China. Between October 2012 and February 2014, 2608 patients who met the following inclusion criteria were recruited: 18 years of age or older, diagnosed with acute IS or TIA, and within 7 days of the index event. In this substudy, patients without completed BPV or were lost to follow-up at 1 year were excluded.
Assessment of BPV
After enrolment, each patient was assigned a semiautomatic upper-arm BP monitor (HEM-4030; Omron, Kyoto, Japan), and patients or their accompanying relatives were trained by nurses to use it. BP was measured by patients themselves or their relatives, and BP data were recorded in an assigned BP diary. Patients were asked to measure BP twice daily within 3 months after onset. We used the mean of morning BP and evening BP as the 1-day BP value. SBP and DBP were both collected. All participants enrolled had at least 3 days of BP measurements. Day-to-day BPV was expressed as SD and coefficient of variation (CV). SD and CV were calculated by the following formula:  and
and  .
.
Follow-up and outcomes
Patients were followed up for clinical outcomes at 3 months through face-to-face interview and at 12 months by telephone. We would call back patients with non-fatal events for a face-to-face follow-up or carry out a home visit. Follow-up through telephone or face-to-face was conducted by trained site coordinators. End-point evaluation included recurrent stroke and cardiovascular disease. Recurrent stroke was defined as a new stroke event (ischaemic or haemorrhagic), accompanied by a new lesion on MRI or CT of the brain.8 Cardiovascular events included myocardial infarction, unstable angina, cardiac death and congestive heart failure.
Statistical analysis
Continuous variables were described by mean±SD. Categorical variables were described by frequencies and percentages. In the univariate analysis, Kruskal-Wallis test was used for comparisons of skewed continuous variables and ordinal variable. Categorical variables were compared with the χ2 statistics or Fisher’s exact test as appropriate.
Patients were classified into two divisions by SBPV > mean level and SBPV < mean level, or by DBPV > mean level and < DBPV mean level. χ2 statistics were used to compare differences in event rates between groups. The associations of SBPV and DBPV with recurrence of stroke and cardiovascular events were investigated using multivariable logistic regression models. Variables were adjusted in the multivariable analyses if established as traditional predictors for recurrent stroke or associated with BPV in univariate analysis with a value of p<0.2. The models were first unadjusted and then adjusted for age, gender, body mass index, medical history (hypertension, diabetes mellitus and dyslipidaemia), qualifying event, and concomitant medication after enrolment (antiplatelet, antilipid and antihypertension) and mean SBP in 3 months.
A two-sided p value of <0.05 was considered to indicate statistical significance. SAS V.9.4 software was used for all statistical analyses.
Results
Characteristics of subjects
Of 2608 patients in the BOSS study, 283 were excluded (106 patients without completed baseline information or BPV data and 177 patients without follow-up at 1 year), and 2325 patients were included in the final analysis. A flow chart of the study is shown in figure 1. The main baseline characteristics of the included subjects are shown in table 1. Among the 2325 patients included, the mean age was 62.52 years and 762 (32.77%) were female. The mean SBP and DBP within 3 months were 136.85±11.14 mm Hg and 79.47±7.88 mm Hg, respectively.
Main baseline characteristics of participants

Flow chart of the study.BOSS, blood pressure and clinical outcome in TIA or IS.
Clinical outcomes and profiles of BPV
Of 2325 patients with IS or TIA, 103 (4.43 %) experienced recurrent stroke and 64 (2.75 %) had cardiovascular events within 3 months. The cumulative occurrence of recurrent stroke and cardiovascular events was 5.89% and 4.30% within 1 year, respectively.
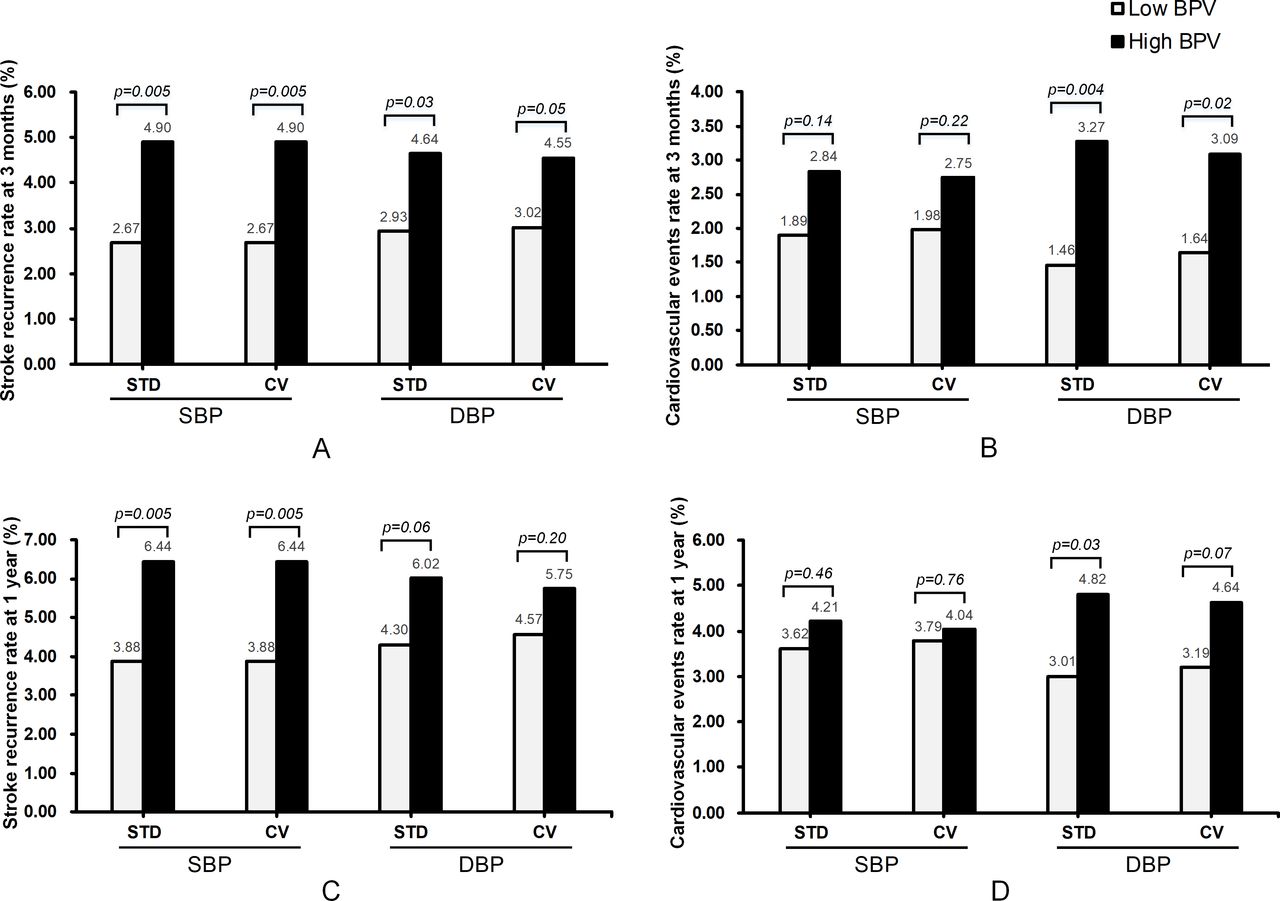
The median SBPVSD and SBPVCV were 8.47 and 6.25. Likewise, the median DBPVSD and DBPVCV were 5.50 and 7.04, separately. Patients were divided into two groups according to the median BPV. Compared with patients in the low SBPV group, patients in the high SBPV group had a higher rate of stroke recurrence at 3 months. Congruously, there was also a statistically significant difference in stroke recurrence in patients with high and low DBPV at 3 months (figure 2A). However, there was no statistical difference between groups by SBPV in terms of cardiovascular event rate, while patients with higher DBPV had an increased rate of cardiovascular events compared with patients in the low DBPV group at 3 months (figure 2B). Similar results were found at 1 year, although the trend was weaker than 3 months. The event rates and probability values are presented in figure 2C,D.

Comparison of stroke and cardiovascular event rates in patients with stroke/TIA at 3 months and 1 year with high and low systolic or diastolic blood pressure variability. (A) Stroke recurrence rate in patients with stroke/TIA at 3 months in different BPV groups. (B) Cardiovascular event rate in patients with stroke/TIA at 3 months in different BPV groups. (C) Stroke recurrence rate in patients with stroke/TIA at 1 year in different BPV groups. (D) Cardiovascular event rate in patients with stroke/TIA at 1 year in different BPV groups. BPV, blood pressure variability; CV, coefficient of variation; DBP, diastolic blood pressure; SBP, systolic blood pressure; STD, standard deviation; TIA, transient ischaemic attack.
Additionally, no interaction between SBPV and age was found for stroke (p=0.50) or cardiovascular events (p=0.85), and neither between DBPV and age for stroke (p=0.25) or cardiovascular events (p=0.70).
Predictive powers of BPV indices
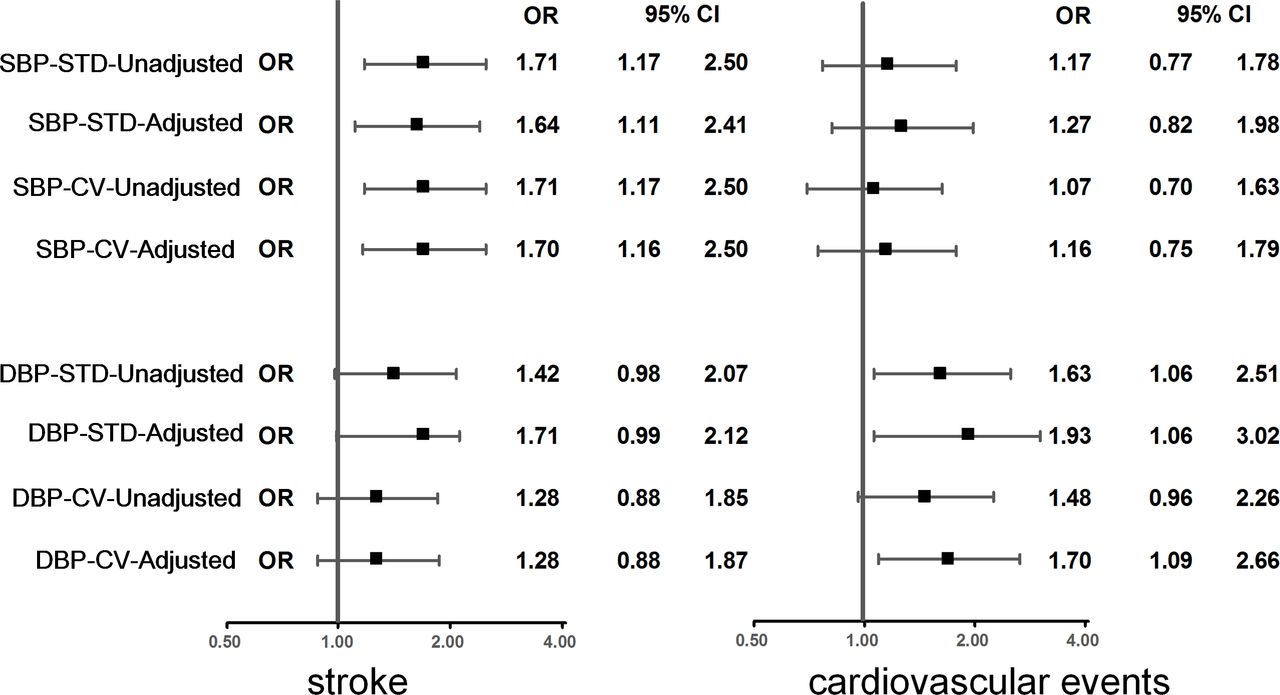
Multivariable logistic regression analyses were used to investigate the association between different BPV indices with stroke recurrence and cardiovascular events. After adjustment for potential confounders, SBPV was associated with stroke recurrence at 3 months. Compared with SBPV, a relative but weaker association was observed between DBPV and stroke recurrence. However, in the same setting, there was no statistical significance between SBPV and cardiovascular events. In contrast, DBPV was strongly associated with cardiovascular events at 3 months. The unadjusted and adjusted ORs with 95% CIs at 3 months are shown in figure 3.

HR for cardiovascular events and stroke recurrence within 3 months according to the quartiles of SBP variability and DBP variability. Adjusted for age, gender, body mass index, medical history (hypertension, diabetes mellitus and dyslipidaemia), qualifying event, and concomitant medication (antiplatelet, antilipid and antihypertension) and mean systolic blood pressure in 3 months. CV, coefficient of variation; DBP, diastolic blood pressure; SBP, systolic blood pressure; STD, standard deviation.
The results at 1 year showed consistent but weaker tendency compared with those at 3 months. SBPV was associated with stroke recurrence at 1 year. Although not significant, there was a trend for high DBPVSD to be related to stroke recurrence. With regard to cardiovascular events, multivariable logistic analysis showed that SBPV had no association with cardiovascular events, whereas DBPV remains associated. The unadjusted and adjusted ORs with 95% CIs at 1 year are shown in figure 4.
HR for cardiovascular events and stroke recurrence within 1 year according to the quartiles of SBP variability and DBP variability. Adjusted for age, gender, body mass index, medical history (hypertension, diabetes mellitus and dyslipidaemia), qualifying event, and concomitant medication (antiplatelet, antilipid and antihypertension) and mean systolic blood pressure in 3 months. CV, coefficient of variation; DBP, diastolic blood pressure; SBP, systolic blood pressure; STD, standard deviation.
Discussion
The present study was based on hospital-based, prospective cohort study aiming to assess BP parameters and clinical outcome in a Chinese population of patients with acute IS or TIA. The following are the main findings: (1) both SBPV and DBPV were associated with stroke recurrence; and (2) DBPV was a strong predictor of cardiovascular events, whereas there was no observed association between SBPV and cardiovascular events.
SBPV was more often investigated and reported in comparison with DBPV. We have noticed that previous studies had mainly focused on subjects with SBPV and stroke, while reports regarding the association between DBPV and stroke have yielded inconsistent results. Studies conducted in 8811 patients ≥55 years with diabetes (69% with a history of hypertension) from the ADVANCE (Action in Diabetes and Vascular Disease: Preterax and Diamicron Modified Release Controlled Evaluation) trial9 found no association between BPV and stroke. In a large cohort of 3 285 684 US veterans (63% with hypertension),10 greater SBPV was proven to be associated with a higher risk for stroke, while DBPV was not examined. Moreover, it has been shown in several previous studies that VVV in DBP had poor correlation with stroke.2 Both SBPV and DBPV showed associations with stroke recurrence in the analysis we conducted on patients with IS/TIA. Similar results were found at 1 year, although the trend was weaker than 3 months, since stroke recurrence happened more frequently during the acute phase of IS/TIA. The results of our study were, to some extent, consistent with a previous report from the Oxford Vascular Study.11 Moreover, we extended previous findings by assessment of BPV through day-to-day monitoring, enabling us to collect more reliable information.12
Another important finding of this study is that DBPV was not only associated with stroke, but was strongly associated with cardiovascular events, even after adjusting for confounding variables. In contrast, a negative association was observed between SBPV and cardiovascular events. BPV parameters may play different roles between cerebrovascular and cardiovascular events. In Asia, the association between SBP level and stroke is stronger than the association between SBP and ischaemic heart disease.13 Hata and colleagues14 showed that the coefficient of SBPV was slightly greater in patients with stroke than in controls,15 but not in patients with myocardial infarction. Consistent with the results of the present study, researchers from the Ohasama Study observed that the predictive power of SBPV level was only for stroke but not for cardiovascular disease.16 The results from the STABILITY trial showed that in patients with stable coronary heart disease, higher VVV of both SBP and DBP is a strong predictor of increased risk of cardiovascular events, but not stroke.4 These results suggest that DBPV should merit more attention in predicting the risk of cardiovascular events. With all the attention on target SBP, DBP is often relegated to a footnote. Our findings reported that episodic fluctuation in DBP might trigger cardiovascular events in a population with established stroke or TIA. The SPRINT trial suggested a benefit of SBP <120 mm Hg; however, optimal DBP treatment goal is still in question.6 The problem raised by the study is whether treatment of SBP that produces high DBPV might inadvertently increase the risk for cardiovascular events in a stroke population.
Several mechanisms may explain the prognostic impact of different patterns of variability in BP. It is widely recognised that SBP control is the most important factor for preventing cerebrovascular and cardiovascular diseases.17–20 However, both SBP and DBP contribute to cerebral blood flow (CBF). Rapid, large falls in BP could reduce CBF, leading to extension of cerebral infarctions.21 In ischaemic areas of the brain during stroke, CBF becomes dependent on mean arterial BP, which is equal to (SBP + 2 DBP)/3. Previous analyses have demonstrated that stroke was best predicted by mean arterial BP,22 23 compared with other BP parameters. The small penetrating end arteries, which supply the medial and basal portions of the brain and brainstem, seem to be particularly vulnerable to the adverse effects of high BP, in as much as these arteries arise directly from the main arterial trunks. Furthermore, greater BPV is associated with greater aortic stiffness and maladaptive carotid arterial remodelling.24 Endothelial dysfunction and subclinical inflammation have also been proposed as mechanisms underlying the association between BPV and outcomes.25–27 Additionally, the association between DBPV and cardiovascular events agrees with the key role of DBP in myocardial perfusion. As we have known, the heart is perfused during diastole. DBP plays a key role in myocardial perfusion. A marked increase in adverse cardiovascular outcomes was found for DBP values below 70 mm Hg according to results from an international cohort study.28 The association of high DBPV with cardiovascular events in this study is consistent with the hypothesis that the risk is mediated through coronary perfusion pressure.
The BOSS study had several advantages. For example, each patient enrolled was assigned a semiautomatic upper-arm BP monitor (HEM-4030; Omron), which made measurements of BP more standard. Additionally, BPV was assessed day to day in this study which is less affected by circadian rhythm, the patient’s status and the conditions of BP measurement. Repeated assessment of BP values by patients themselves or relatives may offer a solid base to assess BPV during the long-term follow-up period.29 There are also known and potential limitations associated with the current analysis. First, the possibility of residual confounding cannot be fully eliminated in an observational study, although several important potential confounders have been controlled in multivariable adjusted models. Second, the follow-up duration in this study is 1 year, which is relatively short compared with previous studies on cardiovascular disease. This may lead to lower cumulative occurrence of cardiovascular events, because the disease emerges over a long period of time determined by its pathological characteristics. In addition, patients receive repeat neuroimaging and electrocardiographic examination only if they had new symptoms or diagnostic signs during the study’s follow-up period, which led to the inability to identify covert strokes or equally subclinical cardiovascular events.
Conclusion
In summary, both SBPV and DBPV are associated with stroke, whereas DBPV but not SBPV may be more informative of cardiovascular disease in the Chinese IS population. The predictive power of BPV indices for stroke and cardiovascular events should be investigated in larger, population-based studies.
References
Footnotes
LD and AC are joint first authors.
LD and AC contributed equally.
Contributors YoW had full access to all of the data in the study and takes responsibility for the integrity of the data and the accuracy of the data analysis. LD, AC, JX, YoW contributed to the study concept and design. JX, LD, YZ, XH analysed the data. LD, AC drafted the manuscript. XM, HL, YiW, XZ contributed to the critical revision of the manuscript for important intellectual content. YZ, AW contributed to the statistical analysis. All authors have read and approved the final manuscript.
Funding This study was supported by grants from the Ministry of Science and Technology of the People’s Republic of China (2016YFC0901001, 2016YFC0901002, 2017YFC1310901), grants from the National Natural Science Foundation of China (81701141), the Young Scientist Program of Beijing Tiantan Hospital (YSP201704), and grants from the Beijing Municipal Commission of Health and Family Planning (no 2016-1-2041, SML20150502). This study was also funded by AstraZeneca, which did not participate in the proposal design, implementation and statistics.
Competing interests None declared.
Patient consent for publication Obtained.
Ethics approval This study was approved by the central institutional review board at Beijing Tiantan Hospital. All patients or the designated relatives gave written consent when enrolled.
Provenance and peer review Not commissioned; externally peer reviewed.
Data availability statement Data are available upon reasonable request. All data are available to researchers on request for purposes of reproducing the results or replicating the procedure by directly contacting the corresponding author.