Article Text

Abstract
Background and purpose Symptomatic intracranial atherosclerotic stenosis (sICAS) is associated with a considerable risk of recurrent stroke despite contemporarily optimal medical treatment. Severity of luminal stenosis in sICAS and its haemodynamic significance quantified with computational fluid dynamics (CFD) models were associated with the risk of stroke recurrence. We aimed to develop and compare stroke risk prediction nomograms in sICAS, based on vascular risk factors and these metrics.
Methods Patients with 50%–99% sICAS confirmed in CT angiography (CTA) were enrolled. Conventional vascular risk factors were collected. Severity of luminal stenosis in sICAS was dichotomised as moderate (50%–69%) and severe (70%–99%). Translesional pressure ratio (PR) and wall shear stress ratio (WSSR) were quantified via CTA-based CFD modelling; the haemodynamic status of sICAS was classified as normal (normal PR&WSSR), intermediate (otherwise) and abnormal (abnormal PR&WSSR). All patients received guideline-recommended medical treatment. We developed and compared performance of nomograms composed of these variables and independent predictors identified in multivariate logistic regression, in predicting the primary outcome, recurrent ischaemic stroke in the same territory (SIT) within 1 year.
Results Among 245 sICAS patients, 20 (8.2%) had SIT. The D2H2A nomogram, incorporating diabetes, dyslipidaemia, haemodynamic status of sICAS, hypertension and age ≥50 years, showed good calibration (P for Hosmer-Lemeshow test=0.560) and discrimination (C-statistic 0.73, 95% CI 0.60 to 0.85). It also had better performance in risk reclassification and provided larger net benefits in decision curve analysis, compared with nomograms composed of conventional vascular risk factors only, and plus the severity of luminal stenosis in sICAS. Sensitivity analysis in patients with anterior-circulation sICAS showed similar results.
Conclusions The D2H2A nomogram, incorporating conventional vascular risk factors and the haemodynamic significance of sICAS as assessed in CFD models, could be a useful tool to stratify sICAS patients for the risk of recurrent stroke under contemporarily optimal medical treatment.
- stroke
- risk factors
- atherosclerosis
- prospective studies
Data availability statement
Data are available on reasonable request.
This is an open access article distributed in accordance with the Creative Commons Attribution Non Commercial (CC BY-NC 4.0) license, which permits others to distribute, remix, adapt, build upon this work non-commercially, and license their derivative works on different terms, provided the original work is properly cited, appropriate credit is given, any changes made indicated, and the use is non-commercial. See: http://creativecommons.org/licenses/by-nc/4.0/.
Statistics from Altmetric.com
WHAT IS ALREADY KNOWN ON THIS TOPIC
Patients with symptomatic intracranial atherosclerotic stenosis (sICAS) are at a considerable risk of recurrent stroke even with guideline-recommended medical treatment. Haemodynamic significance of sICAS quantified with computational fluid dynamics (CFD) model was associated with the stroke risk.
WHAT THIS STUDY ADDS
We developed the D2H2A nomogram to predict stroke risk in sICAS, incorporating diabetes, dyslipidaemia, haemodynamic status of sICAS by CFD model, hypertension and age ≥50 years. It had good performance in predicting same-territory ischaemic stroke within 1 year, in sICAS patients.
HOW THIS STUDY MIGHT AFFECT RESEARCH, PRACTICE OR POLICY
The D2H2A nomogram, incorporating conventional vascular risk factors and the haemodynamic significance of sICAS, could yield a useful tool for risk stratification of sICAS under optimal medical treatment.
Introduction
Intracranial atherosclerotic stenosis (ICAS) is a common cause of ischaemic stroke and transient ischaemic attack (TIA) throughout the world, with a high risk of stroke relapse.1 Medical treatment, including antithrombotic therapy and risk factor management, had significantly lowered the risk of stroke recurrence in symptomatic ICAS (sICAS) patients in the last two decades.2–5 However, the residual risk of recurrent stroke and TIA in sICAS under ‘optimal’ medical treatment by the latest guidelines is still nonnegligible,6 for instance, up to 11% in the first year after an index minor stroke or TIA in the recent subgroup analysis of the population-based Oxford Vascular Study (OXVASC).7 Therefore, it is imperative to identify high-risk sICAS patients, to prompt early intervention and more effective secondary stroke prevention in relevant patients.6
Conventional vascular risk factors associated with vascular diseases including ICAS, such as older age, hypertension, diabetes and dyslipidaemia,8 9 have been key components of established risk scores in risk stratification of ischaemic stroke or certain subgroups of stroke patients, for example, those with atrial fibrillation.10 11 However, there has been no well-established stroke risk prediction tool targeting sICAS patients. Numerous studies had revealed severe (70%–99%) luminal stenosis as an important predictor for stroke recurrence in sICAS,12–14 which has been a dominating indicator in guiding treatment strategies in clinical practice and in therapeutic trials, for example, medical versus interventional treatment, or dual versus mono antiplatelet treatment.6 Yet, other factors such as cerebral haemodynamics could also affect stroke risks in sICAS,15 warranting further investigations. For instance, our previous study had associated haemodynamic metrics of sICAS, quantified using CT angiography (CTA)-based computational fluid dynamics (CFD) modelling, with the 1-year stroke risk.16
In this study, we aimed to develop and compare risk prediction models (in nomograms), composed of conventional vascular risk factors only, plus the severity of luminal stenosis in sICAS, or plus the haemodynamic features of sICAS obtained with CFD modelling, for stroke risk stratification in sICAS.
Methods
Study design and subjects
We analysed data from the SOpHIA (Stroke Risk and Hemodynamics in Intracranial Atherosclerotic Disease) study, a cohort study investigating cerebral haemodynamics in Chinese patients with sICAS using CTA-based CFD models at three teaching hospitals in China.16 All participants provided informed consent.
Ischaemic stroke or TIA patients admitted within 1 week of onset, with the index stroke/TIA attributed to 50%–99% ICAS in intracranial segment of internal carotid artery, M1 middle cerebral artery, V4 vertebral artery or basilar artery confirmed in CTA, were enrolled. The stroke aetiology was diagnosed by experienced neurologists based on the medical history, stroke symptoms, ICAS location and the topology of infarction(s). We excluded patients with (1) the index stroke/TIA caused by restenosis within a stented artery or tandem stenosis of intra- and extracranial arteries; (2) non-atherosclerotic stenosis (eg, vasculitis, dissection or Moyamoya disease) or known arteriovenous malformation or aneurysm; (3) potential cardioembolic stroke (such as atrial fibrillation) or undetermined stroke aetiology; (4) scheduled interventional procedures for the sICAS; (5) prior interventional or surgical treatment of intracranial or extracranial arteries within 1 month and (6) severe comorbidity or lost to follow-up. More details of the study design and inclusion/exclusion criteria were provided in our previous work.16
Clinical and imaging data collection
Baseline data were collected, including demographics (age and sex), vascular risk factors (current smoking, hypertension, diabetes, dyslipidaemia, prior ischaemic stroke/TIA) and blood pressure at admission. Percentage of luminal stenosis in sICAS was assessed in CTA by the Warfarin-Aspirin Symptomatic Intracranial Disease (WASID) method,17 considered as moderate (50%–69%) or severe (70%–99%). Leptomeningeal collateral status was assessed by comparing the laterality of distal small vessels in the anterior/posterior cerebral artery territories in two-dimensional (axial and coronal) reconstructions of CTA images as described previously, in patients with anterior-circulation sICAS.18 In brief, presence of more prominent distal small vessels in ipsilesional anterior and/or posterior cerebral artery territories than contralateral side was considered of good leptomeningeal collaterals; otherwise, poor leptomeningeal collaterals.18
Assessment of haemodynamics in sICAS
We built a CFD model based on CTA images in each case, to simulate blood flow across the sICAS and to quantify its haemodynamic significance with two metrics, translesional pressure ratio (PR) and wall shear stress ratio (WSSR). The detailed methodology of CFD modelling and PR/WSSR quantification was presented in our previous work.16 18–20 In brief, translesional PR was measured as a ratio of mean pressures at poststenotic and prestenotic arterial segments, and WSSR as a ratio of mean WSS at the stenotic throat and prestenotic arterial segment. In patients with ≥2 spatially separated, potentially qualifying sICAS lesions in one artery, poststenotic pressure for PR was measured distal to the most distal lesion, and WSS at the stenotic throat was measured at the lesion with the highest degree of luminal stenosis. A lower PR indicated a larger translesional pressure gradient, and hence possibly restricted antegrade flow, across the sICAS; and a higher WSSR indicated significantly elevated WSS on the lesion. We dichotomised PR as ‘normal’ and low (‘abnormal’) PR (> vs ≤median) and WSSR as ‘normal’ and high (‘abnormal’) WSSR (< vs ≥4 th quartile). Both PR ≤median and WSSR ≥4 th quartile were associated with recurrent relevant ischaemic stroke in the SOpHIA cohort.16 WSSR ≥4 th quartile was also considered of ‘high’ WSS in studies using CFD models to investigate carotid artery and coronary artery diseases.21 22 The haemodynamic status of sICAS was further classified by simultaneously considering PR and WSSR, as normal (normal PR and WSSR), intermediate (normal PR and high WSSR, or low PR and normal WSSR) and abnormal (low PR and high WSSR).
Treatment, follow-up and outcome
All patients were treated with optimal medical therapy as recommended by contemporary guidelines23 and were followed up for 1 year via face-to-face interview at a neurology outpatient clinic or telephone interview. Medications prescribed on discharge were recorded. The primary outcome was recurrent ischaemic stroke in the same territory (SIT) within 1 year, with new infarct(s) on brain CT/MRI at recurrence; or by a neurologist based on newly developed neurological deficits relevant to the SIT and lasting >24 hours, when no brain imaging was available for the diagnosis.16
Statistical analysis
Medians (IQR) and numbers (percentage) were presented for descriptives. The associations between the baseline characteristics as continuous or categorical variables and the primary outcome were first analysed with Mann-Whitney U test, χ2, Fisher’s exact or linear-by-linear association tests, as well as univariate logistic regression. Variables with p<0.1 in univariate logistic regression were then entered in multivariate logistic regression, to detect independent predictors of the primary outcome. Continuous variables (eg, age and blood pressure) were transformed into categorical variables in the analyses. ORs and the 95% CIs were obtained.
Three risk prediction nomograms for the primary outcome were developed: (1) Nomogram I, with conventional vascular risk factors only, including age ≥50 years, history of hypertension, diabetes and dyslipidaemia8 9; (2) Nomogram II, with conventional vascular risk factors above+dichotomised severity of luminal stenosis in sICAS; and (3) Nomogram III, with conventional vascular risk factors+the haemodynamic status of sICAS+other independent predictors of the primary outcome identified with multivariate logistic regression, if any. Weights of different factors in the risk prediction nomograms were assigned based on the coefficients of the variables in multivariate logistic regression. Calibration of a nomogram was assessed by the Hosmer-Lemeshow test and a calibration plot of observed versus nomogram-predicted probability with 1000 bootstrap resamples. Discrimination of a nomogram was quantified by the C-statistic, with 0.6–0.7, >0.7–0.8 and >0.8, respectively, indicating a moderate, good and strong discriminative power. Risk reclassification of different nomograms was assessed by the net reclassification improvement (NRI) and integrated discrimination improvement (IDI) indices.24 25 NRI is an index that measures the reclassification improvement of one nomogram compared with another. IDI is the difference in estimated probabilities of the individuals with and without the event between two nomograms. Positive NRI or IDI with statistical significance (p<0.05) indicates improvement in risk reclassification of one nomogram over another. Decision curve analysis (DCA) was conducted to evaluate the net benefits of different nomograms by plotting against a range of threshold probabilities.26 The net benefit was calculated with true positives minus weighted false positives, with the weight derived from given threshold probabilities (ie, risk of SIT within 1 year in sICAS in this study). Sensitivity analysis was conducted to detect the nomogram’s performance in patients with anterior-circulation sICAS.
All statistical analyses were conducted using SPSS V.26.0 (IBM) and the R software V.4.0.3 (The R Foundation for Statistical Computing, Vienna, Austria), with a two-sided p<0.05 considered statistically significant.
Results
Among 302 potentially eligible patients with sICAS confirmed in CTA, 36 were excluded due to failure in vessel geometry extraction (complex geometry, severe calcification, subtotal arterial occlusion or poor image quality), 17 failure in blood flow simulation in achieving convergence in solving fluid equations and 4 lost to follow-up. Overall, 245 patients were analysed, with a median age of 61 years (IQR 53–69) and 63.7% males; 191 and 54 patients had anterior-circulation and posterior-circulation sICAS, respectively. The median interval between symptom onset and CTA exam was 6 days (IQR 3–11) (table 1).
Baseline characteristics of the patients
Twenty (8.2%) patients had a primary outcome of SIT within 1 year. Baseline characteristics of those with or without the primary outcome are summarised in table 1. Compared with patients without SIT, those with SIT were more likely to have a history of dyslipidaemia (p=0.062), while demographics and other clinical characteristics were similar between the two groups. In addition, the risks of SIT were similar in those with moderate and severe luminal stenosis in sICAS (7.5% vs 8.9%; p=0.688). Regarding the haemodynamic status of sICAS, those with SIT were more likely to have an abnormal haemodynamic status (35.0% vs 14.7%) but less likely to have a normal haemodynamic status (15.0% vs 43.5%; p for linear-by-linear association=0.004). Among those with anterior-circulation sICAS (n=181), the leptomeningeal collateral status at baseline tended to be different between those with and without SIT (p=0.065). Moreover, medications prescribed at discharge (including dual or mono antiplatelet, statins, antihypertensives and antidiabetics) were similar between those with and without the primary outcome (with more detailed data provided previously).16
Calibration and discrimination of nomograms I and II
Nomograms I and II incorporating conventional vascular risk factors without and with severity of luminal stenosis in sICAS, had good calibration in this cohort (p=0.123 and 0.064, respectively, for the Hosmer-Lemeshow test) and moderate discrimination for the primary outcome (C-statistic 0.65, 95% CI 0.51 to 0.80; and 0.67, 95% CI 0.53 to 0.82).
Development, calibration and discrimination of nomogram III
In univariate logistic regression, the haemodynamic status of sICAS was significantly associated with the primary outcome (p for trend=0.005), with a highest risk of SIT in patients with abnormal haemodynamic status (17.5%; OR 6.93, 95% CI 1.69 to 28.35, p=0.007), followed by intermediate (9.6%; OR 3.48, 95% CI 0.93 to 13.02, p=0.065) and normal status (3.0%; reference category). The history of dyslipidaemia (p=0.070) tended to be associated with the primary outcome in univariate logistic regression, and other factors including the severity of luminal stenosis in sICAS were not significantly associated with the primary outcome. In multivariate logistic regression, both history of dyslipidaemia and haemodynamic status of sICAS were independent predictors of the primary outcome (table 2).
Logistic regression analyses of the primary outcome
Therefore, haemodynamic status of sICAS and history of dyslipidaemia, in addition to the conventional vascular risk factors, were incorporated in the risk prediction nomogram III, forming the D2H2A nomogram (Diabetes (two points), Dyslipidaemia (five points), Haemodynamic status of sICAS (7 and 10 points, respectively, for intermediate and abnormal status), Hypertension (one points), and Age ≥50 years (three points); figure 1). The D2H2A nomogram had good calibration in this cohort, according to the Hosmer-Lemeshow test (p=0.560); and the calibration plot showed good agreement between nomogram-based prediction and actual observation of SIT (figure 2). It also had good discrimination for the primary outcome (C-statistic 0.73, 95% CI 0.60 to 0.85).

The D2H2A nomogram for SIT within 1 year in sICAS patients receiving optimal medical treatment. To use the D2H2A nomogram, for instance, a 60-year-old (3 points) sICAS patient with a history of hypertension (1 point) and intermediate haemodynamic status of sICAS (7 points) would have 11 points in the D2H2A nomogram, and hence a 5.0% probability of having SIT within 1 year under contemporarily optimal medical treatment. sICAS, symptomatic intracranial atherosclerotic stenosis; SIT, recurrent ischaemic stroke in the same territory.
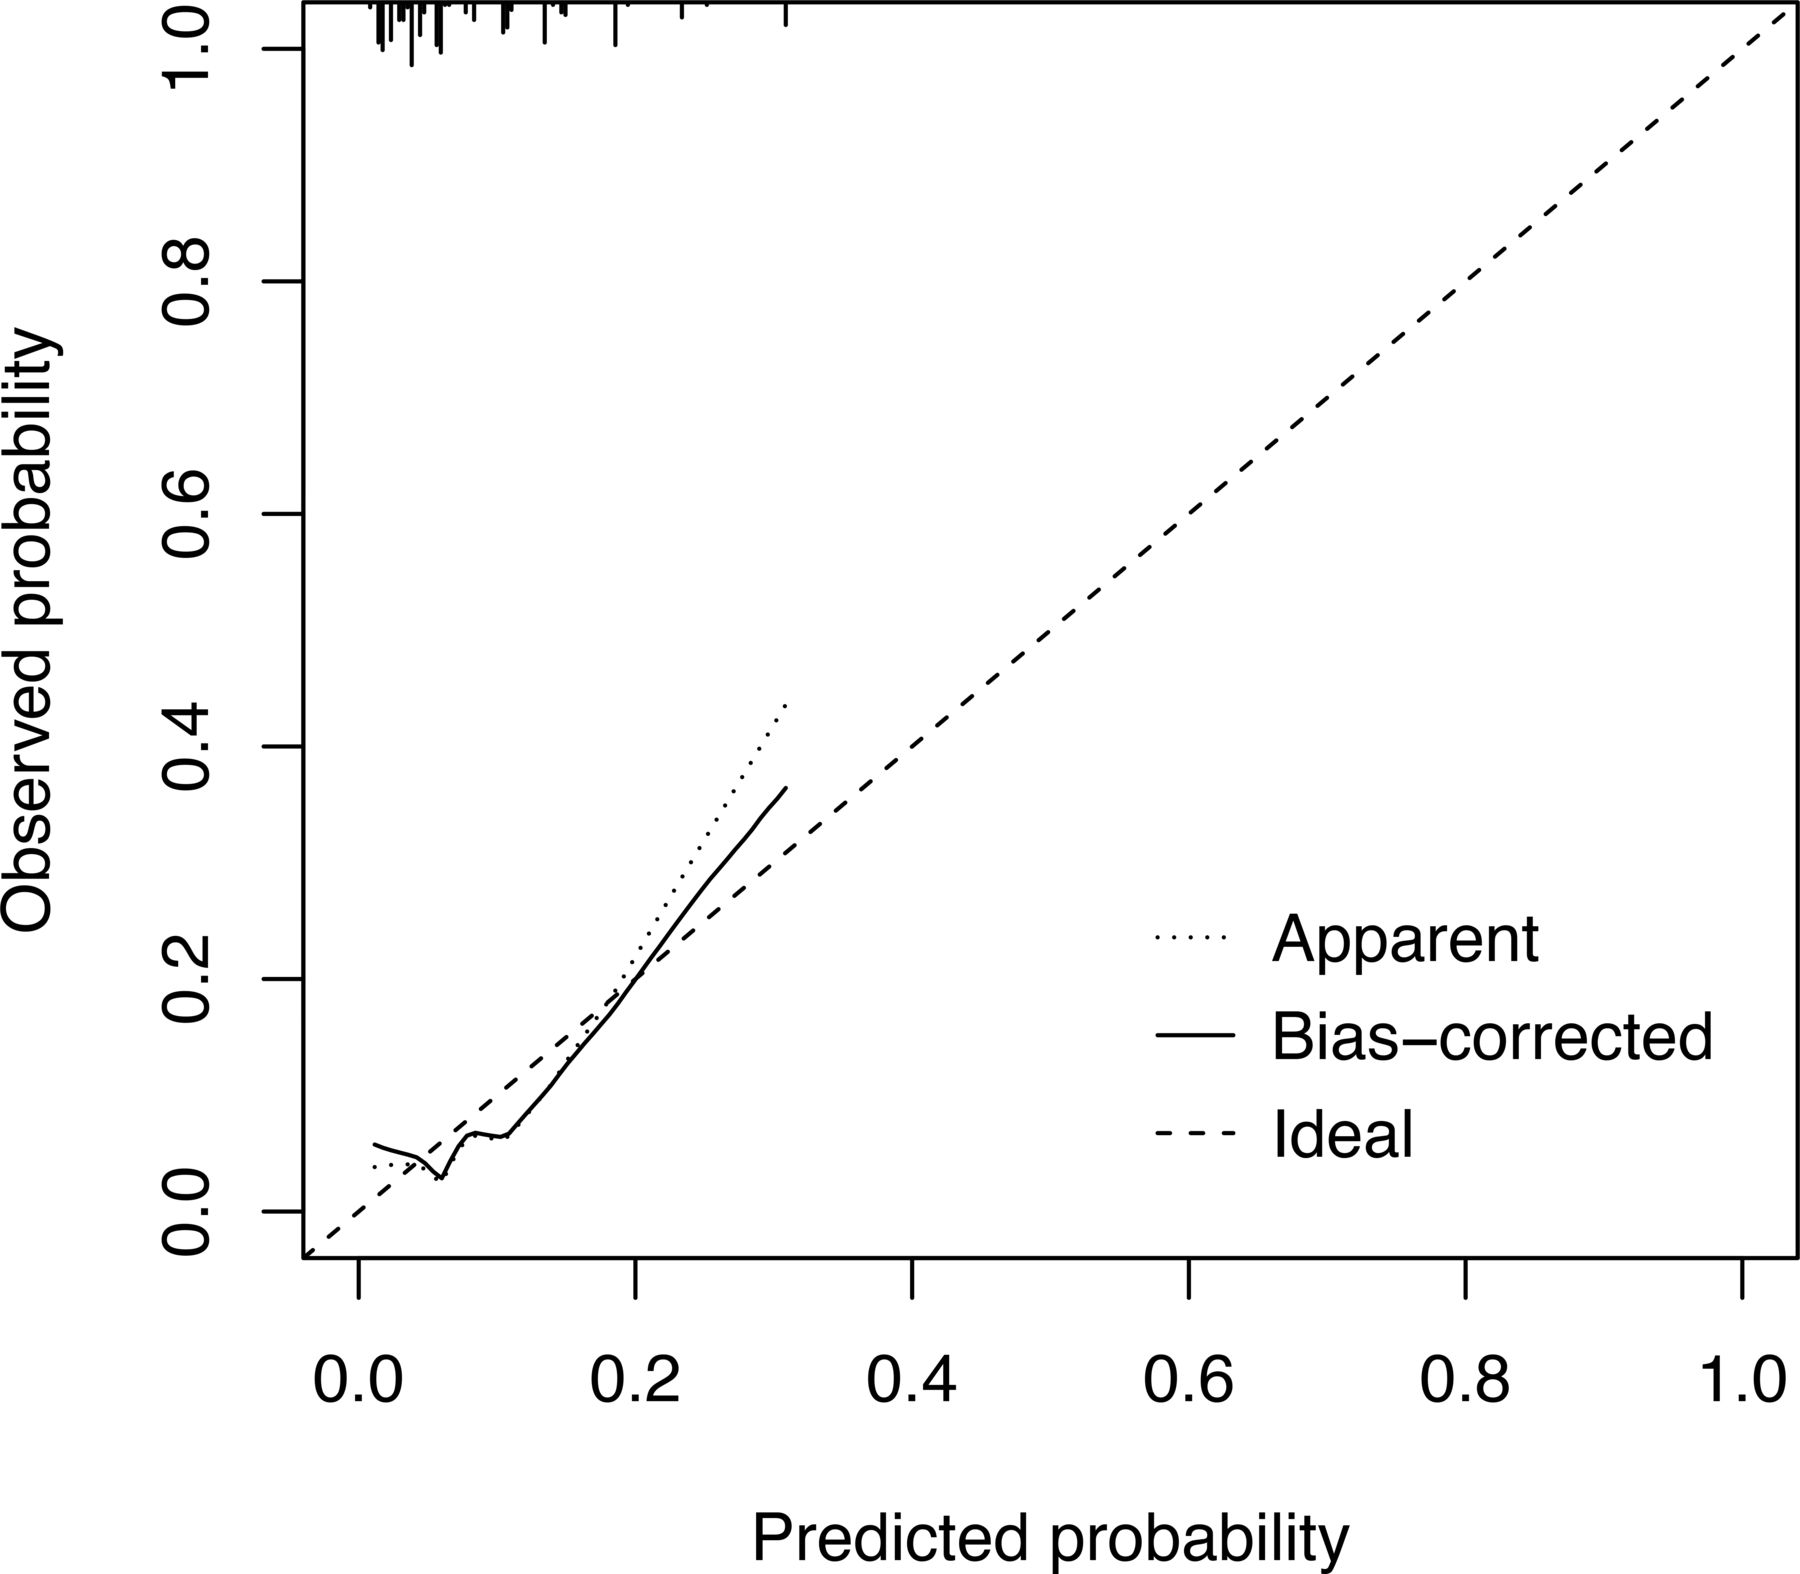
Calibration plot of the D2H2A nomogram for recurrent ischaemic stroke in the same territory within 1 year.
Comparisons of the nomograms in risk reclassification and DCA
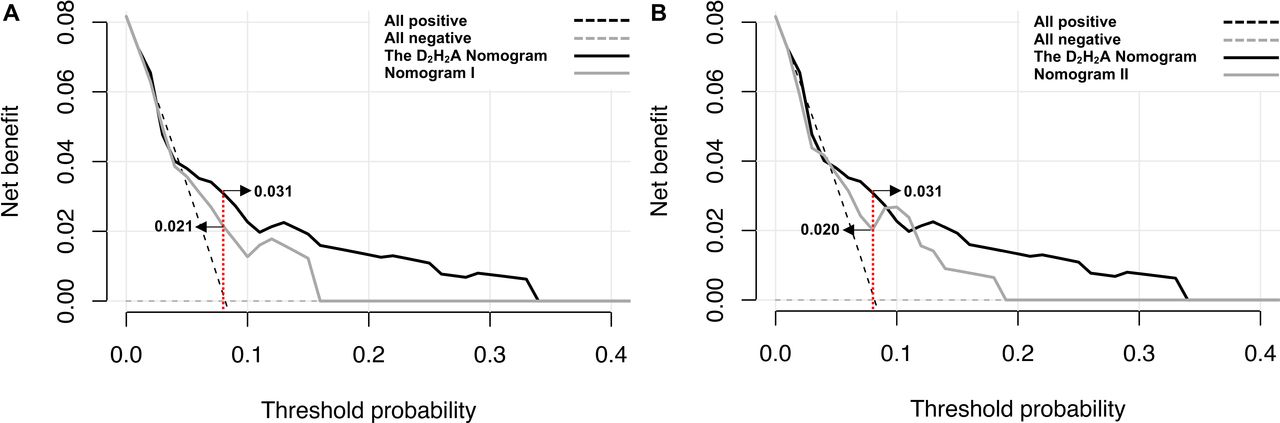
Compared with nomograms I and II, the D2H2A nomogram had positive NRI and IDI indices (all p<0.05; table 3), indicating substantial improvement in risk reclassification by the D2H2A nomogram. DCA showed that the D2H2A nomogram yielded a larger net benefit than nomogram I over a range of 0%–2% and 4%–33% in the risk of the primary outcome (figure 3A), and a larger net benefit than nomogram II over 0%–3%, 5%–9% and 12%–33% in the risk of the primary outcome (figure 3B). For instance, with an 8% 1-year risk of SIT in the study population (suggested in the current study), the net benefits of nomograms I, II and D2H2A were 0.021, 0.020 and 0.031, respectively, meaning the D2H2A nomogram would identify 10 and 11 additional at-risk patients per 1000 patients compared with nomograms I and II respectively, without increasing false-positive predictions.
Comparison of nomograms in risk reclassification

DCA for the three nomograms. The DCA shows the net benefits (y axis) of nomograms to stratify subjects for the risk of an outcome across a range of threshold probabilities of the outcome (x axis). (A) The reference lines (grey and black dashed lines) assume no patient or all patients will have an SIT. The grey and black solid lines illustrate the net benefits of nomograms I and D2H2A in risk stratification of sICAS patients, across a range of threshold probabilities of 1 year SIT (x axis). With an 8% risk of SIT in the study population (red dashed line), nomograms I and D2H2A, respectively, yielded a net benefit of 0.021 and 0.031, suggesting that the D2H2A nomogram would identify 10 more patients at risk of SIT within 1 year per 1000 patients, compared with nomogram I. (B) Similarly, nomograms II and D2H2A, respectively, yielded a net benefit of 0.020 and 0.031, suggesting that the D2H2A nomogram would identify 11 more patients at risk of SIT within 1 year per 1000 patients, compared with nomogram II. DCA, decision curve analysis; sICAS, symptomatic intracranial atherosclerotic stenosis; SIT, recurrent ischaemic stroke in the same territory.
Sensitivity analysis
In patients with anterior-circulation sICAS, the leptomeningeal collateral status (p=0.072) and the haemodynamic status of sICAS (p for trend=0.014) were likely to associate with the primary outcome in univariate logistic regression (online supplemental table 1). In multivariate logistic regression, however, only haemodynamic status was an independent predictor of 1-year SIT (p for trend=0.029; intermediate status: OR 3.80, 95% CI 0.78 to 18.57, p=0.099; abnormal status: 6.07, 95% CI 1.13 to 32.67, p=0.036; online supplemental table 1). Therefore, conventional vascular risk factors and the haemodynamic status of sICAS were included in nomogram III (the D2H2A nomogram) in sensitivity analysis in patients with anterior-circulation sICAS, the same with the overall analyses. It also showed good discrimination (C-statistic 0.73, 95% CI 0.59 to 0.86) and calibration (p for Hosmer-Lemeshow test=0.658) for the primary outcome.
Supplemental material
Discussion
In this study, we developed and compared different risk prediction models in nomograms for the risk of recurrent relevant ischaemic stroke within 1 year, in ischaemic stroke or TIA attributed to 50%–99% ICAS with guideline-recommended medical treatment. We employed conventional vascular risk factors, dichotomised luminal stenosis in sICAS that is commonly used in clinical practice in gauging the severity of the lesion, and haemodynamic status of sICAS obtained with CTA-based CFD modelling, in the nomograms. The D2H2A nomogram, incorporating diabetes, dyslipidaemia, haemodynamic status of sICAS, hypertension and age ≥50 years, had good discrimination (C-statistic 0.73) and calibration in both the overall cohort and the subgroup with anterior-circulation sICAS. Moreover, it improved risk reclassification and provided a larger net benefit in identifying true positives (those truly at a high risk of stroke relapse), than the other two nomograms based on conventional vascular risk factors±severity of luminal stenosis in sICAS. The findings reinforced the important role of focal haemodynamics in sICAS in governing the risk of stroke recurrence in affected patients, while the D2H2A nomogram could be a useful tool for risk stratification of sICAS patients.
Among the conventional vascular risk factors, only the history of dyslipidaemia was significantly associated with the primary outcome (1-year SIT) in the current cohort, which might be explained by the fact that all patients received optimal medical treatment and risk factor management during 1-year follow-up, according to contemporary guidelines. Although we did not record medication compliance or long-term blood pressure, glucose and lipid levels in all patients during a follow-up, medications prescribed at discharge (including dual or mono antiplatelet, statins, antihypertensives and antidiabetics) were similar between those with and without the primary outcome.16 On one hand, this corroborates the effectiveness of the current medical treatment regimen in secondary stroke prevention of sICAS, when the 1-year risk of SIT (eg, 8.2% in this cohort) was significantly lowered as compared with that in the WASID era (up to 12%–15%). The risk of 1-year SIT (5.6%) was even lower in minor ischaemic stroke or TIA patients with 50%–99% sICAS without atrial fibrillation, in the population-based OXVASC study.7 On the other hand, the findings also indicate that stroke risk prediction in sICAS may not work well with vascular risk factors alone, when their effects have been largely controlled with medical treatment. Therefore, we need to search for additional surrogate markers to identify high-risk sICAS patients under the current treatment regimen, as suggested in the latest guideline from the American Heart Association/American Stroke Association on secondary stroke prevention.6
On top of conventional vascular risk factors, the degree of luminal stenosis had been independently associated with the risk of SIT in sICAS patients, for example, in the WASID trial and the Chinese Intracranial Atherosclerosis Study.12 13 For a long time, it had been considered as a sole indicator in scaling the severity of sICAS and in patient selection for therapeutic trials of sICAS. For instance, the Stenting and Aggressive Medical Management for Preventing Recurrent Stroke in Intracranial Stenosis trial was conducted in ‘high-risk’ (70%–99% stenosis) sICAS patients, which has provided substantial evidence for the currently optimal medical treatment regimen in this subgroup of patients, and at the same time closed the window for stenting as an initial treatment in secondary prevention of sICAS.3 However, it is also evident that nearly half (45%) of the SITs in the WASID trial cohort occurred in those with moderate (50%–69%) sICAS.12 In the current cohort, the risks of SIT within 1 year were similar in those with moderate and severe luminal stenosis in sICAS (7.5% vs 8.9%; p=0.688). Therefore, there have been advocates over a more comprehensive assessment of sICAS to gauge its ‘severity’ beyond the luminal stenosis alone.15 27
Our previous studies had revealed the clinical relevance of haemodynamic features of sICAS via CTA-based CFD modelling, in affecting lesion progression and the risk of recurrent stroke in sICAS.16 28 29 In this study, the risk prediction model (the D2H2A nomogram) based on conventional vascular risk factors and haemodynamic status of sICAS had significantly better risk reclassification and larger net benefits in identifying those truly at a high risk of stroke relapse, than the nomogram based on conventional vascular risk factors±severity of luminal stenosis in sICAS. As reported in our previous work, most of the SIT involved multiple infarcts in the borderzone and/or cortical regions.16 Thus, hypoperfusion and/or artery-to-artery embolism could be the probable mechanisms of the recurrent strokes, associated with the abnormal haemodynamic status (low PR and high WSSR) of sICAS,16 30 31 which cannot be fully accounted for by the current medical treatment regimen. These findings suggested that the effect of more severe luminal stenosis in increasing the risk of stroke recurrence might be less prominent than that of the haemodynamic effects of the lesion and the corresponding stroke mechanisms, in sICAS patients under optimal medical treatment. These all echo the rising voices to consider other factors in addition to the severity of luminal stenosis, and/or to target the underlying stroke mechanisms, in therapeutic trials for sICAS.8 For instance, it may be worth investigating the effects of interventional treatment or more stringent medical treatment in those with low PR and/or high WSSR, who are at risk of hypoperfusion and/or plaque vulnerability and distal embolism.
In this study, we used different methods to assess the risk prediction models/nomograms. Compared with nomograms I and II, the D2H2A nomogram of conventional vascular risk factors plus haemodynamic status of sICAS had better discrimination and calibration, with substantially improved risk reclassification for the primary outcome. The results were similar in sensitivity analysis in patients with anterior-circulation sICAS, who had collateral circulation assessed and adjusted in multivariate analysis. Moreover, the decision curve analyses also indicated that the D2H2A nomogram could identify 10 and 11 additional at-risk patients per 1000 sICAS patients over nomograms I and II, respectively, without increasing false-positive predictions, given an 8% 1-year risk of SIT as in the current cohort. These results have demonstrated the potential value of the D2H2A nomogram in risk stratification of sICAS identified with 50%–99% luminal stenosis, for patient selection in future therapeutic trials and more individualised treatment in secondary stroke prevention.
A major limitation of this study was the relatively small sample size, and the disproportional numbers of patients with anterior-circulation versus posterior-circulation sICAS, and those with versus without the primary outcome. In addition, the risk prediction nomograms were developed and assessed in a three-centre cohort study of Chinese patients. Therefore, external validation in larger cohorts with more posterior-circulation strokes and outcome events and in other populations is needed for generalisation of the findings. Second, as in our previous CFD studies, we used a simplified CFD model for blood flow simulation in sICAS, and dichotomised PR and WSSR respectively using the median and fourth quartile according to our previous analyses16 and referring to CFD studies on carotid artery and coronary artery diseases.21 22 However, by far, there are no widely accepted, ‘standardised’ methodology for CFD modelling in sICAS, or established, ‘optimal’ cut-off points for PR and WSSR to scale its haemodynamic significance. Further studies are warranted to validate the CFD modelling methods against other imaging modalities, and to explore for more specific cut-off values for the two haemodynamic metrics to gauge the haemodynamic significance of sICAS. Moreover, CFD modelling in ICAS relies on the quality of the source neurovascular images, and it may be inaccurate or infeasible in cases with severe arterial wall calcification or subtotal arterial occlusion. These are technical limitations of CFD modelling in ICAS that need to be improved in future studies. Last but not least, there are other factors that may affect stroke risk in sICAS, such as positive/negative remodeling32 and the plaque characteristics (plaque ulceration, morphology and components).33 34 These all need to be separately or simultaneously considered in future studies developing risk prediction tools in sICAS.
Conclusions
The D2H2A nomogram, based on conventional vascular risk factors in combination with the haemodynamic significance of sICAS obtained with CFD models, may effectively stratify sICAS patients for the risk of same-territory stroke recurrence. On external validation, it could yield a useful tool for risk stratification of sICAS, for patient selection in future therapeutic trials and more individualised treatment in secondary stroke prevention.
Data availability statement
Data are available on reasonable request.
Ethics statements
Patient consent for publication
Ethics approval
The study protocol was approved by the Joint Chinese University of Hong Kong-New Territories East Cluster Clinical Research Ethics Committee (Reference number 2014.329). Participants gave informed consent to participate in the study before taking part.
References
Supplementary material
Supplementary Data
This web only file has been produced by the BMJ Publishing Group from an electronic file supplied by the author(s) and has not been edited for content.
Footnotes
Contributors Guarantor for the overall content: XL. Study conception and design: KSW, TWL and XL; Data collection: all authors; Data analysis and interpretation: XT and XL; Drafting of the manuscript: XT and XL. All authors reviewed the results and approved the final version of the manuscript.
Funding This work was supported by the Direct Grant for Research, The Chinese University of Hong Kong (Reference No. 2019.033), and General Research Fund, Research Grants Council of Hong Kong (Reference number 14106019).
Competing interests None declared.
Provenance and peer review Not commissioned; externally peer reviewed.
Supplemental material This content has been supplied by the author(s). It has not been vetted by BMJ Publishing Group Limited (BMJ) and may not have been peer-reviewed. Any opinions or recommendations discussed are solely those of the author(s) and are not endorsed by BMJ. BMJ disclaims all liability and responsibility arising from any reliance placed on the content. Where the content includes any translated material, BMJ does not warrant the accuracy and reliability of the translations (including but not limited to local regulations, clinical guidelines, terminology, drug names and drug dosages), and is not responsible for any error and/or omissions arising from translation and adaptation or otherwise.