Article Text

Abstract
Background The existence of transsynaptic retrograde degeneration (TRD) in the human visual system has been established, however the dependence of TRD on different factors such as lesion location, size and manner of lesion acquisition has yet to be quantified.
Methods We obtained T1-weighted structural and diffusion-weighted images for 26 patients with adult-acquired or congenital hemianopia and 12 age-matched controls. The optic tract (OT) was defined and measured in the structural and diffusion-weighted images, and degeneration assessed by comparing the integrity of tracts in the lesioned and in the undamaged hemisphere.
Results OT degeneration was found in all patients with established lesions, regardless of lesion location. In patients with acquired lesions, the larger the initial lesion, the greater is the resulting TRD. However, this was not the case for congenital patients, who generally showed greater degeneration than would be predicted by lesion size. A better predictor of TRD was the size of the visual field deficit, which was correlated with degeneration across all patients. Interestingly, although diffusion-weighted imaging (DWI) is more frequently used to examine white matter tracts, in this study the T1-weighted scans gave a better indication of the extent of tract degeneration.
Conclusions We conclude that TRD of the OT occurs in acquired and congenital hemianopia, is correlated with visual field loss, and is most severe in congenital cases. Understanding the pattern of TRD may help to predict effects of any visual rehabilitation training.
- VISION
- MRI
- STROKE
Statistics from Altmetric.com
Introduction
Homonymous hemianopia occurs when a patient suffers damage to the postchiasmal visual pathway, most commonly the occipital lobe or optic radiation,1 resulting in a visual field deficit corresponding to the size and retinotopic location of the damage. Hemianopia affects approximately 8% of stroke victims,2 and resolves in around 50% of cases, with spontaneous recovery rarely occurring more than 2 months or 3 months post damage.3 ,4
Over the past few years, attempts have been made to develop therapies that may improve visual function in patients with hemianopia.5 ,6 The most common interventions fall into three main groups: optical therapies, eye movement training and restorative therapies including Vision Restoration Therapy7 and Neuro-eye Therapy.8 While the first two methods aim to increase the efficiency of remaining visual processing, Vision Restoration Therapy and Neuro-Eye Therapy specifically aim to restore vision in the affected hemifield. The success of these treatments depends significantly on the extent of retrograde degeneration of the neural pathways involved. As such, it is important to understand the time scale of degeneration as well as the impact of size and location of the damage.
Transsynaptic (also known as transneuronal) retrograde degeneration (TRD) of retinal ganglion cells (RGCs) following the destruction of axonal target locations in the occipital cortex has been investigated extensively in monkeys. The severity of TRD can be summarised as follows: (1) neurons in the lateral geniculate nucleus (LGN) and RGCs degenerate following occipital lesions;9 (2) TRD is most severe in infant macaque monkeys;10 (3) the greatest loss occurs between 1 year and 3 years after the occipital insult;11 ,12 (4) larger insults result in greater TRD;11 and (5) TRD results in around 80% loss of RGCs in the affected foveal regions following complete ablation of striate cortex, predominantly cells that would have projected to the parvocellular layers of the LGN.13
In contrast to the literature from the macaque, the existence of TRD in the human visual system had been controversial until the application of non-invasive human imaging approaches to show conclusive evidence across multiple patients with hemianopia.14 The retinal nerve fibre layer is reduced in patients with congenital and acquired hemianopia, as shown with optical coherence tomography.15 Furthermore, the retinal nerve fibre layer thickness decreases over time following injury16 and can be demonstrated in patients with quadrantanopia secondary to occipital lobe damage.17 Structural MRI has also been used to demonstrate TRD in patients with hemianopia, by computing a metric to compare affected (ipsilesional) and unaffected tracts.12 ,18 Bridge et al18 found evidence of reduced optic tract (OT) size and integrity in all patients with long-standing lesions, whether primary damage was to the OT, LGN or occipital cortex.
Here, we quantify the dependence of human TRD on lesion location and size in a large population of subjects with hemianopia, some with acquired, and others with congenital, damage. It was also considered of interest to include a group of patients with OT damage. In this situation the effects on the OT imaging will be due to direct retrograde and anterograde damage which can be compared with the changes due to TRD.
Methods
Subjects
Twenty-six subjects with substantial unilateral visual field deficits were recruited in Brazil and the UK (details in table 1), together with 12 UK healthy controls (mean age 46 years, range 24–74 years, six women). Patients are labelled according to lesion location (OT (T), LGN (L), optic radiation (R), striate cortex (S), full occipital cortex loss (O)), and whether their field deficit was congenital (c). Subjects described as ‘congenital’ (n=9) may in some cases have acquired damage postnatally, however the damage would have occurred very early in life. The definition of congenital in these cases is based on previous nomenclature and could potentially also be referred to as ‘infantile’, since the precise timing of the event is unknown. All 17 ‘acquired’ subjects sustained visual pathway damage in adulthood, with the exception of S3a whose lesion was acquired at 8 years of age. Humphrey perimetry was not available for R4c and S8c, and DWI data was not collected for S3. Data from five of the subjects presented here were included in a previous study18
Characteristics of patients with hemianopia
Six subjects (starred in table 1) were scanned more than once, at least 1 year apart. The first scan took place within 18 months of lesion acquisition. All subjects gave written informed consent prior to participation.
The location of damage in each patient is indicated by the first letter of the identifier, where ‘T’ indicates OT damage, ‘L’ is LGN, ‘R’ is optic radiation, ‘S’ is striate cortex and ‘O’ is occipital lobe. Since damage to the OT itself and to the LGN will result in direct retrograde degeneration rather than TRD, this group of subjects form a pathological comparison group in which a range of severity of atrophy is to be expected up to and including maximal, total loss of axons. It is unknown, but from the animal and human studies so far seems unlikely, whether total atrophy could ever occur as a result of TRD. It would also be anticipated that this patient group would show a more rapid time course of degeneration which can be compared with the time course of TRD.
Visual field definitions
Visual fields for all patients were acquired using a Zeiss Humphrey Field Analyzer, using the central 24-2 threshold test and SITA-FAST strategy. All patients showed a substantial field loss in the hemifield contralateral to the lesion site (incomplete hemianopia was accepted, with a minimum loss requirement of a quadrantanopia). Mean deviations are given in table 1.
Image acquisition
Diffusion-weighted and T1-weighted structural scans were acquired using either a 3T Siemens Trio (UK) or a 3T Achieva-Intera Philips scanner (Brazil). Standard protocols for T1 and DWI acquisition were used, with T1-weighted scans acquired at a resolution of 1×1×1 mm3, and DWI scans with 2 mm3 isotropic voxels. See online supplementary methods for full parameters. As analyses focused on within subject comparisons, no issues were incurred by the use of two different scanners.
Analysis of OT degeneration using T1-weighted structural imaging
To ensure that OT definition was not affected by head orientation in the scanner, structural scans were reoriented using FMRIB software library (FSL) image analysis software (http://www.fmrib.ox.ac.uk/fsl) so that the OT was parallel to the anterior-posterior axis in standard space, and then resliced parallel and perpendicular to the OT. The OT was measured using an adaptation of the technique used by Bridge et al.18 Masks of equal size were hand drawn over the OT, starting at the optic chiasm and continuing until the OT was no longer distinct from surrounding structures.
For analysis of OT volume and integrity, voxels in the masked region were thresholded according to their T1-weighted signal so that only voxels containing white matter were included in analysis. Intensity thresholds ranged from a minimum of 25% of the greatest intensity in either tract, to a maximum of 85% (leaving only voxels with high white matter integrity). Increasing the threshold decreased the number of voxels included in the masks.
A laterality index (LI) was computed to quantify the difference in volume and integrity between the left and right OTs at each white matter threshold. The LI ((contralesional−ipsilesional)/(contralesional+ipsilesional)) was computed using the tract volumes for all intensity threshold levels. In control subjects, the LI was calculated as (right−left)/(right+left); there was no reason to expect control subjects to have any difference between right OT and left OT. Patient LIs were compared with controls by computing z statistics ((patient score−control mean)/control SD) at each threshold. These measures are referred to as ‘structural LI’.
Quantification of lesion size in patients with occipital lobe lesions
To assess whether OT degeneration was related to the extent of damage to the visual cortex, the volume of the lesion within the occipital lobe was measured in subjects with cortical damage. Occipital lobe regions containing abnormal or absent tissue were identified on T1-weighted scans, and a mask of these regions were created manually. A second mask, encompassing the entire occipital lobe, was also drawn and these masks were compared to determine the proportion of occipital damage.
Analysis of OT degeneration using diffusion-weighted imaging
The OT was identified for analysis in the diffusion-weighted images using a two-stage process. In control subjects, probabilistic tractography19 ,20 was used to trace the OT from a mask drawn in a single plane of the optic chiasm to the LGN (defined using the Juelich histological atlas21). Fifty thousand samples were tracked from each voxel in the chiasm and only tracts reaching the LGN were retained. A ‘group’ OT mask was created by transforming the tracts into standard space and summing across subjects. The mask was thresholded at 75% overlap in participants. This method could not be used to directly define the OT in patients, as the ipsilesional side of many patients was not sufficiently well defined.
In the second stage, Tract-Based Spatial Statistics22 was used to project all fractional anisotropy (FA) and mean diffusivity (MD) images onto a symmetrical mean FA tract skeleton in Montreal Neurological Institute (MNI) standard space. This skeleton was then masked by the tract region of interest (ROI) produced by the probabilistic tractography to leave only the skeleton of the OT. Voxels within these regions were then thresholded for individual subjects according to signal intensity in the raw T2 image, to remove lesion voxels with minimal T2 signal. Mean FA and MD were calculated for the OT in each hemisphere of each subject.
Results
Patients were divided into groups depending on the lesion location: OT, LGN, optic radiation, V1 and occipital lobectomy. Figure 1A–E shows an example of a T1-weighted structural image from each patient group and a control. In each case the affected side is indicated with the white arrow, and the LI for each case is indicated by the figure. Patients were considered to have ‘stable’ lesions if the damage had occurred more than 2.5 years prior to the scan.

Examples of optic tract degeneration in patients with hemianopia. T1-weighted structural images were used to identify the optic tracts in all participants. The slices shown here, perpendicular to the optic tract, are approximately 3 mm posterior to the optic chiasm. Images A–E show patient T2 (Optic Tract), L1 (Lateral Geniculate Nucleus), R1 (Optic Radiation), S1 (Striate) and O3 (Occipital), respectively. Image F shows a control subject. Scans are oriented radiologically. Arrows show the tract in the damaged hemisphere, and the laterality index is indicated in each case.
The structural LIs from patients with stable, acquired lesions, grouped according to lesion location, are shown in figure 2A. The V1 group was subdivided into hemianopia and quadrantanopia. Although patient T3 was only 17 months post damage, the data were used because direct damage to the OT will result in anterograde (Wallerian) and retrograde degeneration depending upon the precise location of the damage, hence the OT will degenerate more rapidly. As mentioned in the methods section, including patients with OT damage allows us to determine the maximum damage likely to be measured, as the site of the lesion is close to the measured region. Control subjects did not show any difference in OT size between hemispheres (black line in figure 2A).

Plots of structural laterality indices (LIs) for patients with acquired damage. (A) Mean LIs of patients with established acquired lesions over the range of intensity thresholds, grouped according to lesion location. Locations of damage include the optic tract, lateral geniculate nucleus (LGN), optic radiation, full occipital resection, and striate cortex, split into hemianopia and quadrantanopia. The mean LI for controls is shown in black. (B) Laterality index at 75% intensity threshold, as indicated by the black box in A. SEs across subjects are shown. The gray bar shows the average across all patients; ** indicates that this acquired patient group is significantly greater than controls (p<0.001).
OT degeneration was present in all patients with established lesions who showed significantly higher structural LIs than controls (z>2.44, p<0.01). Patients with occipital lobe resections or damage to the tract itself showed the largest structural LIs while those with partial occipital damage or optic radiation damage showed lower LIs. Damage to LGN and lesions resulting in quadrantanopia had the lowest LIs of all the patients. In order to quantify the damage, the LI at an intensity value 75% of the maximum signal from the T1-weighted image was extracted for each individual. From hereon, this extracted value is referred to as the structural LI. The mean and SE of these values is shown for each group in figure 2B. Across the whole group of acquired patients, non-parametric independent samples median test of structural LI showed a highly significant difference between controls and patients (Test stat=18.1, p<0.001), indicated by the final bars of figure 2B which show the mean value across acquired patients and controls.
Congenital hemianopia leads to a significant decrease in white matter integrity
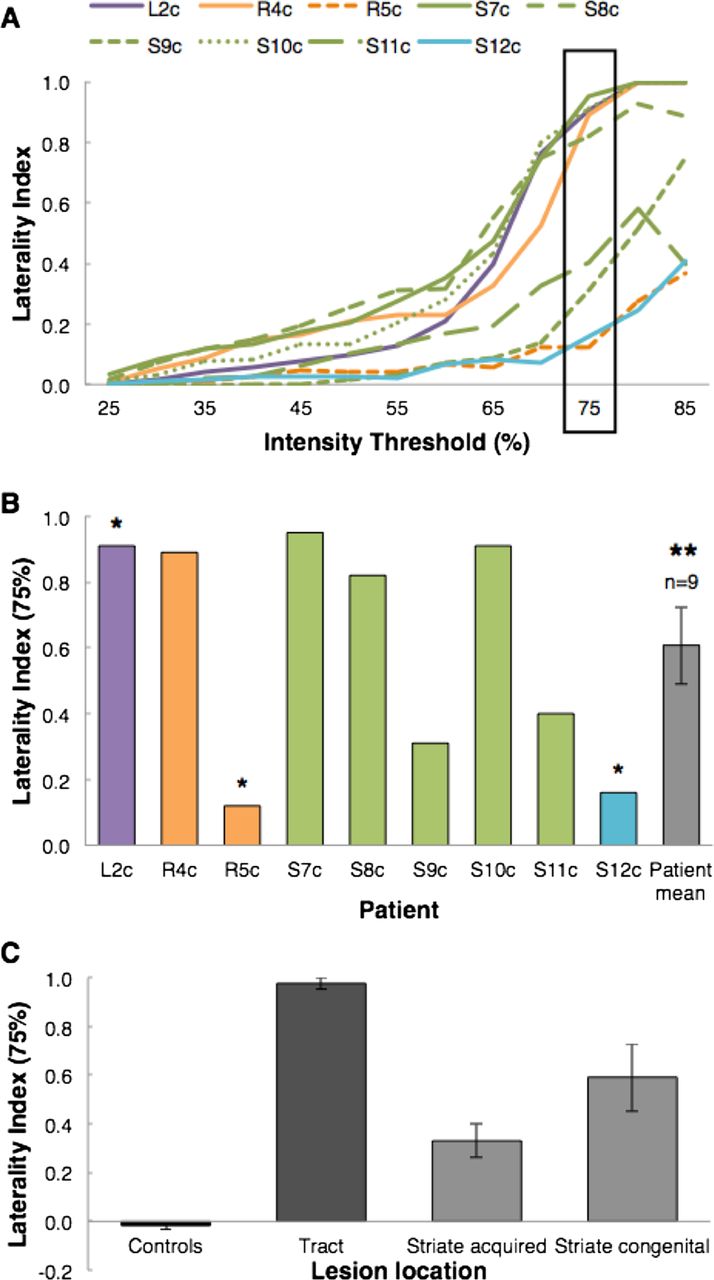
Each of the nine congenital cases is shown separately in figure 3A,B, coloured according to lesion location. The majority of lesions in the congenital group are to V1 (n=6), with two cases having lesions to the optic radiation, and one with LGN damage. As for the acquired cases, structural LIs are highest for the V1 lesions resulting in a hemianopia, and smallest for patients with quadrantanopia following postgeniculate damage. The patient with damage to the LGN (quadrantanopia) has a similar structural LI to patients with hemianopia following V1 damage, but since this quadrantanopia is due to a large arteriovenous malformation it may be that other thalamic structures such as the pulvinar and potentially the optic radiation are also affected. Again, the final bar of figure 3B indicates the means of the structural LI across all patients with congenital damage, which is significantly greater than sighted controls (Test stat=17.3, p<0.001).

Plots of laterality indices for congenital patients. (A) Laterality indices (LIs) of patients with congenital lesions over the range of intensity thresholds, coloured according to lesion location (as with acquired cases). Lateral geniculate nucleus lesions are shown in purple, V1 lesions are either in green (hemianopia) or light blue (quadrantanopia), and optic radiation damage is shown in orange. (B) LIs at the 75% intensity threshold for each patient. Single asterisk * identifies patients with quadrantanopia. Double asterisks ** show that the congenital patient group is significantly greater than controls (p<0.001). (C) Shows the mean and SD of LIs for sighted controls, patient with tract damage, acquired striate lesions and congenital striate lesions.
Figure 3C shows the mean of these values across four different groups: healthy controls, patients with acquired OT lesions, patients with acquired striate cortex damage and patients with congenital damage to striate cortex. There is a significant effect of group, F(2,23)=38.9, p<0.0001. Furthermore, post hoc tests indicate that both striate cortex groups show significantly higher LI than controls, and lower LI than tract patients (p<0.05). The two striate cortex groups, acquired and congenital do not, however, differ significantly (p=0.132).
OT degeneration is proportional to the amount of occipital damage in acquired, but not congenital, hemianopia
To determine the relationship between OT degeneration and lesion size, only patients with occipital damage (n=14) were considered. Patient lesion sizes varied considerably, ranging from minimal damage affecting just a portion of striate cortex in several congenital patients, to full occipital lobectomy in one hemisphere (100% damage). Figure 4A shows the relationship between the structural laterality at 75% and occipital lesion size for the patients with acquired damage. The highly significant correlation (r=0.95; p<0.005; one-tailed Pearson correlation) is clear from the plot, as the greatest structural LI occurs in the largest lesions. In contrast, the subjects with congenital hemianopia do not show this strong correlation and, indeed, do not show a significant correlation (r=0.26; p=0.31). Figure 4B shows the relationship between these values in the congenital cases. It is clear from the graph that lesion size is considerably smaller in this group, with the maximum damage around 20%. However, these small lesions can clearly have a significant effect on the white matter integrity in the affected hemisphere. The labelled cases show a higher structural LI for the lesion size than would be predicted from the graph of the acquired subjects. These small lesions are located specifically within V1 (figure 4C), and have therefore damaged neurons relatively early in the visual pathway, and are of critical importance for visual function.

The relationship between optic tract degeneration and lesion size for patients with occipital damage. (A and B) Plots showing the correlation between the degree of structurally measured optic tract degeneration (intensity threshold 75%) and the extent of occipital damage in the patients with acquired (left, diamonds) and congenital (right, triangles) cortical lesions. (C) T1-weighted images showing the lesion location (indicated by the white arrows) in three congenital subjects with high optic tract laterality.
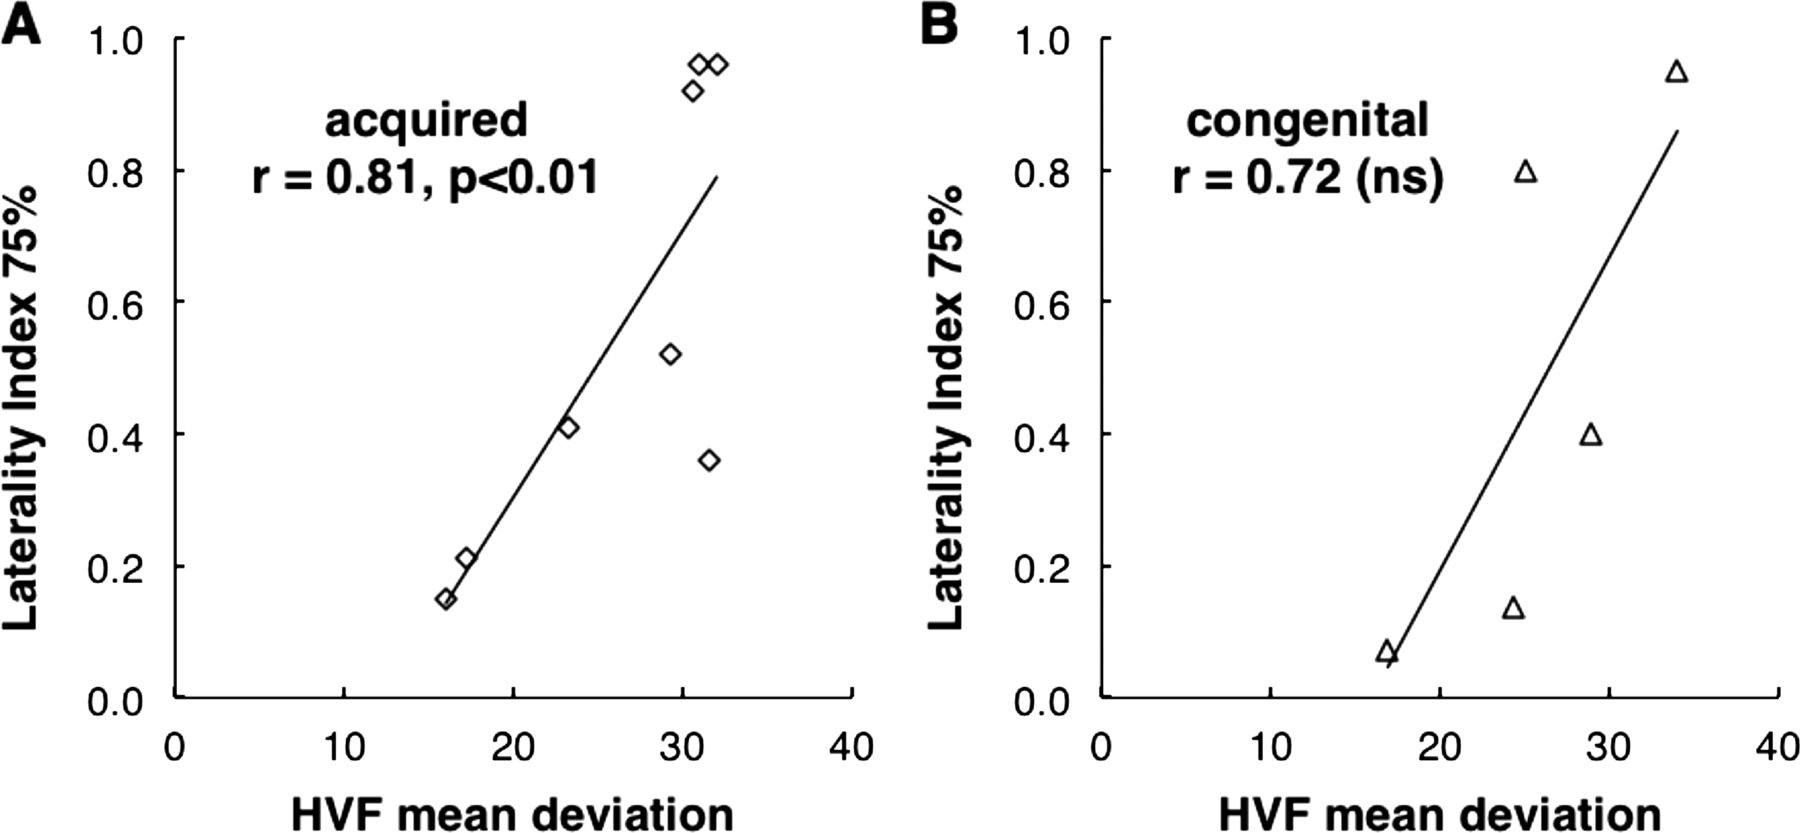
The structural LIs were also correlated to the visual field loss, as quantified using Humphrey perimetry. Figure 5A shows this significant relationship in the patients with acquired lesions (r=0.81; p<0.01), while the congenital cases are shown in figure 5B. Although the correlation is high in the congenital cases (r=0.72), the smaller number of patients in this category means that this is not a significant correlation (p=0.090). Moreover, the regression line for the two groups of patients with hemianopia is remarkably similar, indicating a similar relationship in the two groups.

The relationship between optic tract degeneration and size of the visual field deficit for patients with occipital damage. Plots showing the correlation between optic tract structural laterality index and the Humphrey visual field (HVF) mean deviation on the hemianopic side. Acquired patients are shown in A (diamonds) and congenital patients in B (triangles).
Longitudinal changes in structural LI show that OT degeneration occurs over time, and is a result of processes additional to immediate effects of the initial insult
The previous analyses were focused on the patients with ‘stable’ lesions, acquired at least 2.5 years prior to imaging. In addition to the stable cases, a further seven cases with more recent damage were also studied (table 2). To quantify the rate of degeneration, patients in this group were scanned on multiple occasions. Structural LIs for this group are shown in figure 6, grouped according to lesion location. Controls scanned twice, with a year between scans, showed no significant difference in structural LI between scans.
Details of patients scanned on more than one occasion

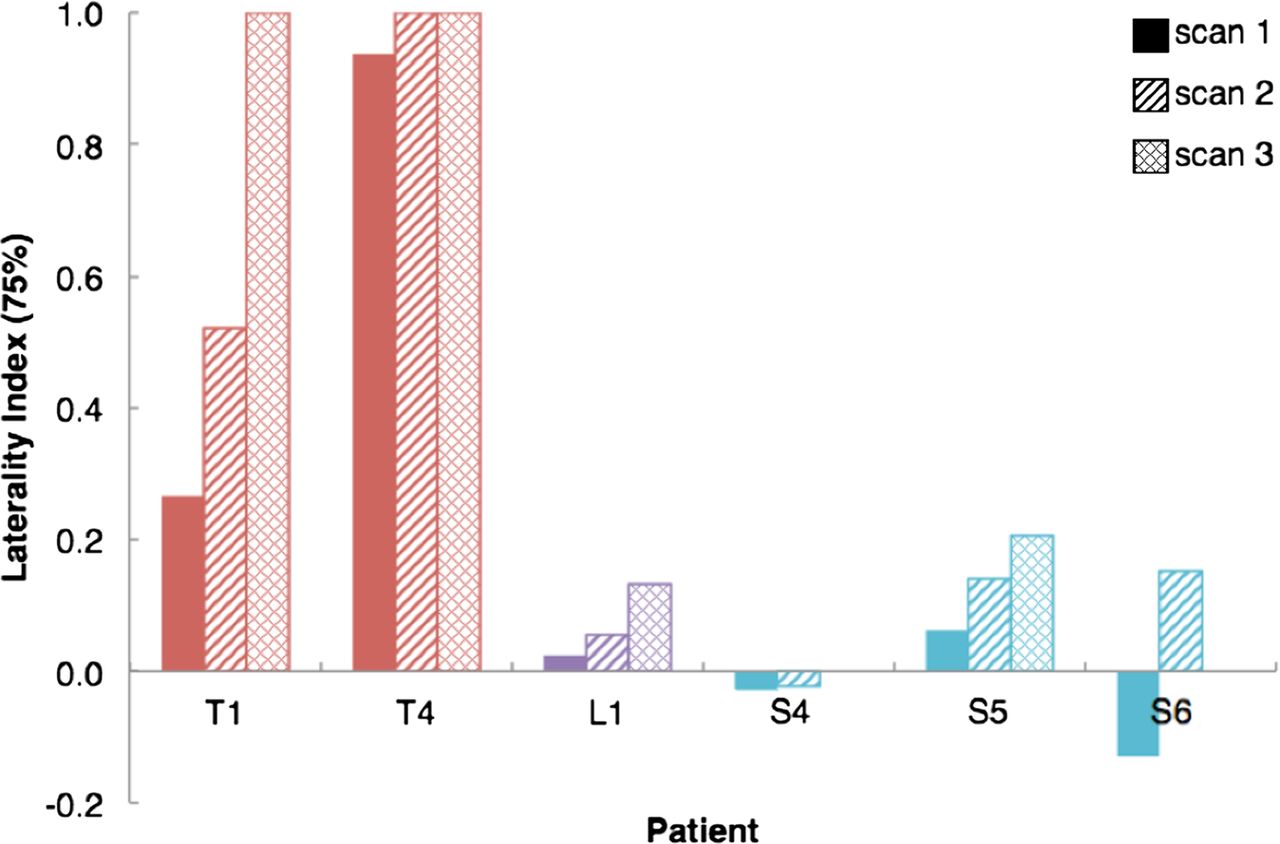
Comparison of structural laterality index across time for patients who have been scanned twice or more. The result from the earliest scan is illustrated by the solid bar, the second scan by the bar containing diagonal lines and the third scan (where it exists) by the bar containing cross-hashing. The colour of the bar indicates the location of the damage, orange is tract damage, purple is lateral geniculate nucleus damage and cyan is striate cortex damage.
The location of damage clearly affects the rate of degeneration with the greatest change seen in T1a who suffered damage to the OT directly, 11 months prior to the first scan. The structural LI increased rapidly to a value close to 1 almost 3 years after the damage, indicating that the tract is severely compromised. Two patients with V1 damage (S5, S6) also show an increase in atrophy of the ipsilesional OT, over a period of 2.5 years in S5, with the initial scan at 8 months after surgical resection, and 1.5 years for S6 (beginning at 18 months post stroke).
Only one patient did not show an elevated LI relative to controls (S4), and the lesion in this case was to V1, resulting in quadrantanopia. The most recent scan was at 2 years from damage, and it is likely that the degeneration is ongoing in this case. Additionally, patients with quadrantanopia will generally have reduced degeneration relative to full hemianopia. Whether TRD in this case is also slower, remains to be determined.
Diffusion-weighted measures can provide laterality measures
Since diffusion-weighted imaging can quantify white matter integrity in fibre bundles, analysis of FA and MD extracted from these images were used in two ways. First a LI comparable with the analysis from the T1-weighted images was undertaken (DWI-FA and DWI-MD), to ensure correlation between the two approaches. Second, the mean FA/MD values within the affected OT were correlated with the structural and diffusion-extracted LI (table 3). MD was not found to be a good predictor of tract degeneration, and so results focus on FA.
Correlations between DWI and structural measures of tract degeneration
One of the major points to make is that, unlike the structural measurement, the diffusion-weighted measures were often difficult to extract. Because FA is so sensitive to partial voluming, accurate identification of the tract is critical, and the tract cannot impinge on surrounding grey matter or cerebrospinal fluid (CSF). Therefore values were extracted using a white matter skeleton that projects FA values from the centre of an individual tract to the centre of that tract in standard space.
Figure 7A,B shows the relationship between the structural LI and the DWI-FA LI. While acquired patients show a significant correlation, the graph shows that there is considerable variability, particularly in the cases showing a large structural LI. Indeed, the DWI-FA LIs are much lower than the structural values in general, presumably because the range of values of FA found within white matter, whether damaged or intact is reasonably low. Therefore, while structural LI can reach almost 1, the highest DWI-FA LI was less than 0.2. Correlations between mean FA and structural and DWI-FA LIs are shown in online supplementary figure 1A–D.

Comparison of the laterality indices for structural and DWI measures of optic tract integrity. Scatterplots show the correlation between DWI laterality index (LI) and structural LI for all patients (A), and for patients with damage restricted to the occipital lobe (B).
Discussion
The large number of patients with hemianopia scanned in this study has allowed a quantification of the effect of lesion size and location. Retaining the integrity of the OT is clearly crucial to visual perception, and therefore a measure of its degeneration can be used for long-term prognosis and may be of importance in predicting the outcome of vision restoration therapies.
Human TRD appears to follow a similar pattern to non-human primate
Investigation of non-human primate TRD suggested that animals in which V1 was lesioned when they were juveniles had the most severe disruption of the OT.10 The current study, by investigating acquired and congenital damage, also appears to suggest that this is the case in humans. One issue with the congenital patients is that the field defect is often picked up by chance at a sight test, not infrequently during adulthood. It is therefore not necessarily possible to determine the exact period at which damage was sustained. Since there is no obvious ‘event’ causing the damage, and patients are generally unaware of the field deficit, it is reasonable to assume that damage is likely perinatal. Furthermore, given the absence of any suggestion of birth trauma or an injury or illness in early life such as encephalitis, it is likely to be predominantly prenatal.
At least in the patients studied here the congenital lesions tend to be smaller, but result in comparable field deficits to patients with acquired damage. It is often posited that damage occurring early in life when the brain is still within the ‘critical period’ ought to have less effect on function.23 However, this does not appear to be the case when damage is within the visual pathway. Indeed several of the patients with V1 damage have full hemianopia in spite of relatively small lesions. Further studies are in progress to assess subcortical function in patients with acquired and congenital hemianopia (such as pupil responses to visual stimuli). Following adult-onset lesions, the time-course of the degeneration shown by this methodology appears to be compatible with the results shown in primates12 and using optical coherence tomography in humans.16 It is the case, however, that patients with damage acquired more than 2.5 years previously have been considered here to have ‘stable’ TRD. Only additional longitudinal scanning of patients between 2.5 years and 5 years can determine whether no further degeneration occurs beyond 2.5–3 years. Correlation between TRD and duration does not address this question sufficiently as lesion size has a greater effect on TRD than duration.
Lesion size and field deficit correlate significantly in patients with acquired damage
There is a highly significant correlation between lesion size and structural LI, as might be predicted from the animal literature.11 While the major visual pathway to the cortex is through the LGN to V1, various smaller projections that bypass V1 are also present. Indeed, these pathways have been posited to underlie the ability of some of these patients to make unconscious ‘guesses’ about visual stimuli (blindsight).24 Thus, where damage is specific to V1, any projections from the LGN or the pulvinar25 that may project to V2,26 V5/MT27 ,28 or other extrastriate regions may still be intact, and therefore OT fibres are preserved. As the lesion size is increased within the occipital lobe, the additional pathways are also affected, and therefore there is no longer a useful function for the OT.
In the case of congenital hemianopia, it is possible that very early lesions lead to different types of reorganisation, and potentially that there is greater input from subcortical structures that bypasses V1. However, any such reorganisation does not appear to be sufficient to minimise visual field loss or to prevent TRD.
Diffusion-weighted imaging is less reliable than structural measures
Since diffusion-weighted imaging is a relatively direct surrogate measure of white matter integrity, it was expected to provide a sensitive measure of degeneration in the OT. However, in this study, the FA appeared to provide a less sensitive measure of OT integrity than the structural measure taken from the T1-weighted image. While there was a significant correlation between the two laterality measures, it is unlikely that the DWI-FA measures from the patients could be reliably distinguished from control subjects. There could be multiple reasons for this lack of sensitivity, the most likely being due to the technical difficulties of identifying the tract in the diffusion-weighted data. The diffusion-weighted images are lower resolution than the T1-weighted images, 2 mm isotropic voxels rather than 1 mm, and, as echo planar images, more susceptible to distortion. The laterality measure used on the structural images takes into account any partial voluming at the border of the OT, while this cannot be accomplished with the diffusion-weighted images. Although the diffusion-weighted data from the current study did not provide adequate prediction of TRD, it may be that higher resolution images acquired at higher field strength could improve the quality of the derived measures of FA and MD.
Interestingly, measures of MD in this study showed no correlation with the structural measures, which is contrary to the usual pattern in neurodegeneration where a decrease in FA is accompanied by an increase in MD.29 This may be linked to a similar issue where partial voluming has a greater effect on MD than FA. This type of issue is less problematic when all tracts are within the white matter, rather than surrounded by CSF.
Conclusion
This large imaging study of patients with acquired and congenital hemianopia has confirmed that the human brain shows a similar pattern of transneuronal retinal degeneration to that seen in the macaque monkey. The subjects with congenital damage show the greatest TRD, while lesion size also determines the amount of TRD.
Acknowledgments
The authors thank Steven Knight for operating the scanner.
References
Supplementary materials
Supplementary Data
This web only file has been produced by the BMJ Publishing Group from an electronic file supplied by the author(s) and has not been edited for content.
Files in this Data Supplement:
- Data supplement 1 - Online supplement
Footnotes
-
Contributors RSM and HB contributed to experimental design, data acquisition, data analysis and data interpretation. PJ and CLY contributed to data acquisition, MJ contributed to data analysis. JLB and GTP contributed to experimental design and data interpretation. CK and FC contributed to data interpretation, and all authors were involved in the writing of the manuscript.
-
Funding This work was supported by a Royal Society University Research Fellowship to HB, a MRC scholarship to RSM and a São Paulo Research Foundation (FAPESP) grant 09/51425-6 for CLY. CK is supported by the National Institute for Health Research (NIHR) Oxford Biomedical Research Centre based at Oxford University Hospitals NHS Trust and University of Oxford. The work described in this paper is also supported by the University College London Comprehensive Biomedical Research Centre and the Moorfields Biomedical Research Centre.
-
Competing interests None.
-
Ethics approval Ethical approval was granted by the Oxfordshire National Health Service Research Ethics Committee B, and the University of Campinas’ ethics committee.
-
Provenance and peer review Not commissioned; externally peer reviewed.
-
Data sharing statement The authors are happy to share anonymised data on request from other researchers. All participants have consented to the sharing of data.
-
Dedication This article is affectionately dedicated to the memory of the late Professor Alan Cowey, FRS (1935–2012).