Article Text

Abstract
Background: The optimum management of patients with moyamoya disease remains controversial.
Objectives: To examine retrospectively the correlation between the degree of haemodynamic stress and the clinical presentation by measuring cerebral haemodynamics and metabolism using positron emission tomography (PET).
Methods: 57 patients with moyamoya disease (mean age 32 years, range 12 to 64), classified into five groups according to clinical manifestations, underwent PET measurement of cerebral blood flow (CBF), cerebral blood volume (CBV), cerebral metabolic rate for oxygen (CMRo2), and oxygen extraction fraction (OEF) using 15O labelled gases. The regional values in patient groups were compared with a normal group.
Results: CBF in non-symptomatic patients, patients presenting with transient ischaemic attacks (TIA), and patients with haemorrhagic onset (H) was not significantly lower than in normal controls in any region. CBV in the TIA group and in patients with infarction associated with TIA (I/TIA) was significantly higher than in the controls in most regions. OEF in the frontal, parietal, and temporal cortex was significantly higher in the I/TIA group than in the controls. Patients in the H group and those with a permanent deficit with infarction (PD group) had decreased metabolism with normal OEF. Multivariate analysis to test the distribution of the three dimensional vector (CBF, CBV, OEF) showed significant differences between every possible pair among the six groups except NS v H and H v PD in the frontal cortex.
Conclusions: The haemodynamic status of moyamoya disease is not uniform, and severe haemodynamic stress occurs in selected subgroups of patients.
- CBF, cerebral blood flow
- CBV, cerebral blood volume
- CMRo2, cerebral metabolic rate for oxygen
- MTT, mean transit time
- OEF, oxygen extraction fraction
- PET, positron emission tomography
- ROI, region of interest
- TIA, transient ischaemic attack
- cerebral blood flow
- cerebral blood volume
- misery perfusion
- positron emission tomography
Statistics from Altmetric.com
- CBF, cerebral blood flow
- CBV, cerebral blood volume
- CMRo2, cerebral metabolic rate for oxygen
- MTT, mean transit time
- OEF, oxygen extraction fraction
- PET, positron emission tomography
- ROI, region of interest
- TIA, transient ischaemic attack
Moyamoya disease is characterised as a progressive occlusion of the terminal portion of the bilateral internal carotid artery, accompanied by the development of collateral networks to compensate for the reduced cerebral perfusion.1 Although these features are common to all patients with the syndrome, the clinical presentation is not uniform. Ischaemic symptoms are the most frequent clinical feature in the juvenile population, but the severity of the ischaemia is variable. Some patients have only transient motor deficit with well preserved intelligence, while others present with progressive stroke and severe mental retardation or persistent neurological deficits. Haemorrhagic events are more common in the adult than in the juvenile population, although ischaemic presentation in adults is by no means uncommon.2–4 In recent years, we have also encountered non-symptomatic cases incidentally diagnosed by magnetic resonance (MR) angiography. This variability in the clinical presentation of moyamoya disease might reflect a variable interaction between the worsening haemodynamics with disease progression and the protection conferred by collateral development. We postulated that the degree of haemodynamic compromise may vary in patients with different clinical manifestations.
Although there have been many reports on the preoperative haemodynamic pattern and its improvement with surgical treatment,5–9 there is still controversy over the management of this disease.10,11 This may arise partly because patients were treated without clarifying their variable haemodynamic factors. It is our assumption that the optimum treatment strategy for each clinical presentation should be determined by knowledge of the particular haemodynamic conditions.
In the present study, we retrospectively analysed the cerebral haemodynamics and metabolism data in 57 Japanese patients with moyamoya disease, mainly adults, obtained using positron emission tomography (PET) between 1991 and 2000. We attempted to clarify the correlation between the clinical presentation and the haemodynamic findings in order to determine the optimal treatment strategy for each disease subtype.
METHODS
Subjects
The study subjects included 57 consecutive patients with moyamoya disease aged over 10 years (mean age 32 years, range 12 to 64). We divided them into five groups based on the clinical presentation.
Non-symptomatic patients
Seven patients were non-symptomatic (NS group; mean age 28 years, range 17 to 40); they were free of focal ischaemic symptoms but had been incidentally diagnosed on magnetic resonance imaging (MRI) and MR angiography. The reason for MRI screening was either that they had a relative with the disease or that they had non-ischaemic symptoms such as chronic headache. None of these subjects had infarcted lesions on MRI.
Symptomatic patients
Symptomatic patients were categorised into ischaemic or haemorrhagic types. The haemorrhagic group (H group; mean age 33 years, range 15 to 53) consisted of 12 patients with the initial symptoms of haemorrhage. These patients had well preserved activities of daily living after intraventricular bleeding or a minor intracerebral haemorrhage. These patients were examined no sooner than four months after the onset of symptoms. Patients with a severe deficit after massive parenchymal damage were not included in the current series.
Patients with ischaemic onset were further categorised according to whether or not they complained of transient ischaemic attacks (TIA) when they were referred to our clinic. Symptoms in patients with TIA included motor, sensory, visual, or language deficits which resolved within 24 hours. Twelve patients with TIA were free from infarcted lesions on T2 weighted MRI done before the PET study and were categorised as pure TIA (TIA group; mean age 24 years, range 12 to 40). The other 16 patients had infarcted lesions on T2 weighted MRI and were categorised as the TIA with infarction (I/TIA group; mean age 37 years, range 13 to 64). The other ischaemic patients had permanent deficits such as motor or language deficit or disturbed higher cerebral function detected by intelligence or memory tests, but were free from TIA. In these patients the interval between the initial interview and the PET measurement was two months at most. All these patients had infarcted lesions on MRI and were categorised as having permanent deficit because of cerebral infarction (PD group, n = 10; mean age 37 years, range 19 to 53).
Patient data were compared with those of normal volunteers with normal MRI and no history of neurological disorder (control group, n = 6; mean age 49 years, range 20 to 66).
All study protocols were approved by the ethics committee of the Tokyo Metropolitan Institute of Gerontology. All participants gave their written consent after being informed of the details of the study, including the objective of the measurements, the duration of the study, the amount of radiation exposure, and the blood sampling involved. In the case of patients under 20 years of age or those with mental or memory deficit, written consent was given by parents or appointed attendants.
PET measurement
The PET study was carried out using a Headtome-IV scanner (Shimadzu Corporation, Kyoto, Japan). An arterial catheter was inserted into the radial artery for blood sampling. The transmission data were acquired with a rotating germanium-68 rod source for attenuation correction.
The regional cerebral blood flow (CBF), cerebral metabolic rate of oxygen (CMRo2), and oxygen extraction fraction (OEF) were measured using continuous and consecutive nine minute inhalations of C15O2 and 15O2 gas with continuous arterial blood sampling, employing a table-lookup technique.12,13 The regional CBF and OEF were calculated with lookup tables created from the arterial whole blood and plasma radioactivity curves, and corrected for delay and dispersion.14 The cerebral blood volume (CBV) was measured by a three minute inhalation of C15O with blood sampling.15 The OEF was corrected for the effect of the regional CBV.16 The mean transit time (MTT) was calculated as CBV/CBF.
PET data analysis
All the PET data were analysed using the image analysis software system “Dr View” (Asahi Kasei Joho System Company, Tokyo, Japan). The regions of interest (ROI) were manually placed over the cerebellar cortex, lower and upper frontal cortex, temporal cortex, occipital cortex, parietal cortex, sensorimotor cortex (mainly of the hand area) (targeted to premotor, primary motor, and primary sensory cortex), putamen, and thalamus. Each of the cortical ROIs consisted of a series of 1 cm diameter circles along the cortical rim. Putaminal and thalamic ROIs were a 2×3 cm ellipse and a 2 cm diameter circle, respectively. The ROIs were placed using a brain atlas,17 avoiding the infarcted areas.
In the analysis of patient data, the ROI values were analysed in the cerebral hemisphere with the lower CBF, as the pathology in the hemisphere under more severe haemodynamic stress determined the clinical manifestations in each patient. For normal controls, the mean of two hemispheric values was taken for each subject. The data obtained are expressed as mean (SD) for each patient group and the controls.
Statistical analysis
Differences between the groups were examined. A general linear model regression analysis, which is an expansion of analysis of covariance (ANCOVA), was undertaken for each of the five variables (CBF, CBV, OEF, CMRo2, MTT) as the dependent variable, using a model that consisted of the intercept, the effect of “group” (five kinds of disease state plus control), the effect of “region” (nine regions), the interaction between group and region, and age as covariates. Age was included in the model because the age distribution was different between the groups. Contrasts were made on the group by region interaction effects to test the difference between the normal controls and each of the five disease states for each region, making a total of 45 contrasts for each variable. Bonferroni’s correction was applied for multiple comparisons, and the level of significance was set at p<0.05. This statistical analysis is similar to an ANCOVA for each region independently, but is more powerful because the error is estimated from the data for all regions. To justify t tests and F tests, normality was checked for the residuals in each test. A few outliers (for each subject for CBF, CBV, and OEF analysis) were removed, and the remaining data were tested again. As for the CBV values, log transformation was applied before the statistical analysis because CBV had a skewed distribution owing to augmentation of the vasculature by moyamoya vessels. As a result, normality of the residuals was confirmed for every test carried out in this study. Exclusion of the outliers did not change the statistical results.
Next, the correlation among the variables was examined by plotting the mean values among CBF, CBV, and OEF for each group. This analysis was undertaken on the lower and upper frontal cortex, the region considered to be most commonly affected in Moyamoya disease. To test for significant differences between the groups in the multivariate space and to examine the correlations among the variables, a multivariate analysis of covariance was carried out for the vectors of three dimensions (CBF, CBV, and OEF) as the dependent variable, using a model that consisted of the intercept, the effect of group, the effect of region, and age as covariates This model was used after confirming that the interaction between region and group was not significant among these frontal regions. CMRo2 was not included among the dependent variables because of possible dependence among CBF, OEF, and CMRo2. MTT was not included in the analysis as it is calculated from CBV/CBF. Contrasts were made on the “group” effects to test for the difference between every possible pair among the six groups—making a total of 15 contrasts—by F tests with Wilks’s λ. For this multivariate analysis, normality was checked for the residuals for three variables after prepreprocessing, as stated in general linear regression analysis (exclusion of three outliers and log transformation of CBV data). Bonferroni’s correction was applied for multiple comparisons, and the level of significance was set at p<0.05. The residual correlation coefficient was evaluated to examine the correlation among the variables after correcting for age, group, and region.
The statistical analyses were done using the JMP statistical software package (SAS Institute Inc, Cary, North Carolina, USA).
RESULTS
ROI analysis and PET images
Table 1 gives the results of general linear model regression analysis for each variable (CBF, CBV, OEF, CMRo2, and MTT), showing a significant increase or decrease in the disease groups compared with the normal control group (tables 1 and 2).
Regional data for frontal, parietal, and temporal cortices
Regional data for occipital cortex and basal ganglia
CBF in NS, TIA, PD, and H groups was not significantly lower than in the normal controls in any region, but in the I/TIA group the difference reached significance in many cerebral regions.
CBV in NS, PD, and H groups was higher than in the normal controls in all cerebral ROIs, and significantly so in the frontal cortex. The increase in CBV in the TIA and I/TIA groups was much more marked than in the other patient groups and was statistically significant in most cerebral regions. The increase was more than double the control value in the upper frontal and sensorimotor regions.
CMRo2 in the PD group was lower than in the controls in all regions except the thalamus and cerebellum. CMRo2 in the I/TIA and H groups was also decreased significantly in some areas within many of the cerebral regions. The degree of decrease was greatest in the PD group throughout all areas of the cerebral cortex.
An increase in the OEF was found in the frontal, parietal, and temporal cortex in the I/TIA group compared with the normal controls. The OEF in the TIA group was the second largest in all regions; it was significantly different from the controls in the upper frontal region.
In all regions except the thalamus and cerebellum, mean MTT ranged from shortest to longest in the following order: normal control, NS, H, PD, TIA, and I/TIA. MTT was significantly longer in the I/TIA group than in the controls in all these regions. MTT in NS group was longer than in the controls, but the difference was not significant in any region.
None of the measured variables showed any difference from control values in the thalamus and cerebellum (areas rarely affected in moyamoya disease) in any of the subgroups.
Figure 1 shows PET images of representative patients from each of the five patient groups and the normal control group. The haemodynamic characteristics of each group are expressed in a side by side comparison of the images (see legend for detail).
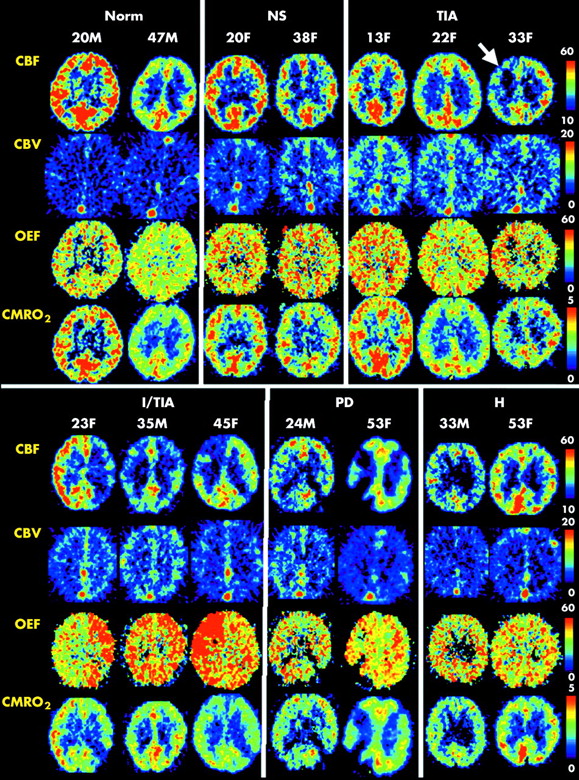
Positron emission tomographic images of two or three representative patients from each of the five patient groups and the normal control group are shown using the same colour scale. A slice including the bodies of the lateral ventricles is displayed for each subject. The intergroup differences in cerebral blood flow (CBF), cerebral blood volume (CBV), oxygen extraction fraction (OEF), and cerebral metabolic rate for oxygen (CMRo2) expressed in table 1 are well shown in these images. CBV was higher in the NS group than in the controls, and higher in the TIA group than in the NS group, although CBF showed no apparent difference among the three groups. Some patients in the TIA group had focally decreased CBF, as exemplified in the third patient (arrowed). The OEF values in these regions were somewhat higher than in the rest of the brain. However, the increase in OEF was more prominent in patients in the I/TIA group. Patients in the PD group had extensive infarction, and the OEF in non-infarcted areas was not increased. Patients in the H group did not have increased OEF, and the CBV increase was as mild as in the NS and PD groups. H, patients with haemorrhagic onset; I/TIA, patients with TIA plus infarction; Norm, normal control; NS, non-symptomatic patients; PD, patients with infarction and permanent neurological deficit; TIA, patients with TIA without infarction.
Analysis of correlations among multiple factors
In order to interpret the pathophysiological features of cerebrovascular disease, it is necessary not only to clarify the alteration of single factors but also the altered coupling of multiple factors. In this study, the variation in haemodynamics was most prominently observed in the frontal cortex (table 1). Thus we plotted the means of the two frontal regions (lower and upper) in the three graphs shown in fig 2, panels A to C. Graph 1 (panel A) plots the correlation between CBF and CBV; graph 2 (panel B) plots that between CBF and OEF; and graph 3 (panel C) plots that between OEF and CBV. In all these graphs, the regions belonging to the same subtypes had closely similar plots.

Two dimensional plots of the correlations between the cerebral blood flow (CBF; x axis) and cerebral blood volume (CBV; y axis) (panel A), CBF (x axis) and oxygen extraction fraction (OEF; y axis) (panel B), and OEF (x axis) and CBV (y axis) (panel C). The means of two frontal regions among all the subjects are plotted. To test for significant differences between the groups (CBF, CBV, OEF) in three dimensional multivariate space, a multivariate analysis of covariance was carried out. This analysis showed a significant difference between every possible pair among the six groups except NS v H, and PD v H. In these graphs, significant and non-significant intergroup differences, as given in Results, are indicated by arrows with black and white heads, respectively. Among all subtypes, the I/TIA group had maximally increased CBV and OEF in the range of decreased CBF. The TIA group had maximal CBV and an increase in the OEF that was somewhat less than in the I/TIA group. The means of the NS, PD, and H groups were closely similar in all the graphs, and the degree of haemodynamic stress was milder in these groups than in the I/TIA and TIA groups. H, patients with haemorrhagic onset; I/TIA, patients with TIA plus infarction; Normal, normal control; NS, non-symptomatic patients; PD, patients with infarction and permanent neurological deficit; TIA, patients with TIA without infarction.
To test for significant differences between the groups in multivariate space, a multivariate analysis of covariance was carried out for the vectors of the three dimensions (CBF, CBV, OEF) as the dependent variable, as stated in Methods. This analysis showed a significant difference between every possible pair among the six groups except NS v H and PD v H, suggesting important variations in the pathophysiological state in moyamoya disease. The correlation coefficients among the residuals were low (−0.021 for CBF v log CBV, −0.354 for CBF v OEF, and 0.064 for log CBV v OEF), supporting the effectiveness of the multivariate analysis on the three variables.
Figure 2A plots the correlation between CBF and CBV. CBV was higher in the NS group than in the normal controls, but the ranges of CBF did not differ between these groups. CBV was even higher in the TIA group and the difference was significant, but the CBF range was still within that of the control and NS groups. CBF in the I/TIA group was lower than in the TIA group within a similar CBV range, and CBV in the PD group was lower than that in the I/TIA group within the same CBF range. The H group lay between NS and PD, and there was no significant difference in multivariate distribution between H and NS, and H and PD.
Figure 2B plots the correlation between CBF and OEF. In this plot, the I/TIA group had a significantly raised OEF in the range of decreased CBF, and this group had a different multivariate distribution compared with all the other patient groups and normal controls.
Figure 2C plots the correlation between OEF and CBV. Groups NS, PD, and H were distributed similarly, and there was no significant difference in multivariate distribution between NS and H, or H and PD. CBV in these three groups was higher than the normal controls within the similar OEF range. CBV in the TIA group was raised even further. The range of OEF in the TIA group extended slightly rightward along the highly increased CBV range. The OEF of the I/TIA group was even higher than in the TIA group within a similar CBV range.
DISCUSSION
Characteristics of haemodynamic factors and clinical presentation
In this paper we have shown that there are differences in haemodynamic characteristics among the various clinical presentations of moyamoya disease. This may have important implications for the evolution of the disease, as well as helping to determine the appropriate treatment for a particular patient.
Even asymptomatic patients (the NS group) had a raised CBV compared with normal controls, and the difference was significant in the upper frontal and sensorimotor cortices. Though this indicated a perfusion pressure below normal, the prolonged asymptomatic period without any infarction suggests that perfusion had not fallen far enough to elicit an ischaemic event. CBV in the patients with TIA without infarction (the TIA group) was double that of the normal controls within the same resting CBF range, and the patients developed TIAs under these conditions. This CBV value may indicate the limit of vasodilator compensation needed to preserve resting flow. It was interesting that the ischaemic event occurred when the resting CBF was in the normal range. This paradoxical finding suggests that CBF may decline below the resting condition and reach the ischaemic range when some physiological stress is added. Such a paradoxical steal phenomenon is observed in the blood flow tolerance test when the vascular bed is maximally dilated and autoregulation completely lost.18,19
In patients with TIA symptoms plus lesions (the I/TIA group), a marked increases in the OEF together with a TIA event is strongly suggestive of further deterioration. The MTT—a variable that should have an inverse relation with cerebral perfusion pressure—was larger in the I/TIA patients than in any of the other groups; hence the haemodynamic compromise in this group was the severest among all the patient groups.
Once the permanent deficit had occurred and stabilised (the PD group), CBV in the non-infarcted area decreased from the range found in the I/TIA patients, as shown in fig 2A. The decreased demand for oxygen delivery is thought to lead to a decrease in the vascular bed, thereby resulting in a return of the OEF value to the normal range, as indicated in fig 2B.
The haemodynamic status of the haemorrhagic cases (the H group) should be considered in a different context, as the cause of deterioration is not an ischaemic event. Most patients with haemorrhagic onset are symptom-free until just before the event. The regional mean values in the H group were closely similar to those of the NS group in the graphs in fig 2. However, many cortical and basal regions in the H group showed significantly decreased CMRo2. Thus it is reasonable to assume that functional deterioration caused by the haemorrhage is the main feature of the H group, and that the degree of haemodynamic stress of H patients is generally as moderate as in NS patients. Multivariate correlation analysis also supports this hypothesis, as the three dimensional (CBF, CBV, OEF) vector of the H group was not significantly different from the NS and PD groups.
Significance of graded haemodynamics for patient management
Clinical management of patients with moyamoya disease should be individualised on the basis of the haemodynamic stress evidenced by assessment of CBF, CBV, OEF, and MTT. At the same time it is clear that there are some common correlations between the clinical presentation and the level of haemodynamic stress. Thus far, there have been no reliable follow up studies of moyamoya disease based primarily on haemodynamic data. However, the risk of further deterioration from ischaemic events can be inferred using the more widely investigated natural course of chronic atherosclerotic carotid occlusion20,21 as a reference.
The I/TIA type is characterised by an increased OEF in the dimension of markedly increased CBV. This may constitute justification for carrying out surgical revascularisation in I/TIA patients, given that there is a high risk of further stroke.20,21 The NS, PD, and H patients with normal OEF values and only moderately increased CBV and MTT may not be at high stroke risk in the near future.21,22 The haemodynamic conditions occurring in the TIA group cannot be considered an analogue of atherosclerotic carotid disease, as a highly increased CBV in the normal or only mildly increased OEF range is rarely observed in atherosclerotic patients.21 In practice, these patients often undergo operations because they present with transient ischaemic symptoms of a type that can be effectively ameliorated by surgical revascularisation. Thus to determine the optimal treatment for this type of patients, we may need to consider not only the stroke risk in the immediate future, but also the possibility of functional amelioration by treatment, the long term benefits for younger patients, and the possible worsening of the haemodynamic state because of progressive occlusion of the carotid artery. As the natural history of treated and untreated patients with moyamoya disease is less clear than in atherosclerotic disease, long term follow up of these patients is necessary. Assessment of the subjects’ haemodynamic condition will be mandatory in such studies in order to compare the natural course of the disease and the effectiveness of treatment among the patient groups.
We also propose that the management of each patient should be determined by their haemodynamic condition. Although PET information is of greatest value in assessing this, it is not usually available in daily clinical practice. Thus, establishment of more easily accessible alternative methods for measuring the degree of haemodynamic stress is necessary. Acetazolamide challenge using quantitative CBF measurement23 and perfusion weighted MRI24 may be the best candidates for this purpose. Evaluation of the same patient groups using PET, acetazolamide challenge, and perfusion MRI may be necessary to clarify the value of each method.
REFERENCES
Footnotes
-
Competing interests: none declared