


Abstract
Carotid arterial stiffness measured by techniques of speckle tracking echocardiography is helpful to assess vascular wall deformation. We conducted a study to investigate the relationship between vascular deformation of the carotid artery and ischemic stroke in the elderly.
We recruited 89 consecutive individuals aged ≥60 years (mean age = 72±6 years; 31 men) from a community health survey program. Ten (11%) had a history of ischemic stroke. Carotid B-mode images were acquired using a high-resolution vascular probe equipped on an echocardiographic system. Circumferential strain (CS) and strain rate (CSR) were obtained by speckle tracking techniques with a region of interest covering the entire depth of the common carotid arterial wall.
Both CS and CSR were significantly correlated with beta index and distensibility but not with carotid intima-medial thickness and pulse wave velocity. In the comparison between patients with or without history of stroke, carotid CS (1.46% ± 0.54% vs. 2.75% ± 1.23%; P = 0.002) and CSR (0.30±0.13 1/s vs. 0.47±0.18 1/s; P = 0.007) were significantly lower in patients with stroke. Multivariable analysis showed that both carotid CS and CSR were independent factors associated with previous strokes.
Carotid wall deformation indices are useful for assessment of local carotid arterial stiffness. CS and CSR of carotid artery measured by speckle tracking techniques were associated with previous ischemic stroke in the elderly.
Arterial stiffness increases with vascular aging. It can be measured by pulse valve velocity (PWV), which measures the propagation of pulse waves throughout the arterial tree to represent regional arterial stiffness.1 Stiffness of the local artery can be assessed by changes in the vascular diameter with M-mode ultrasonography. However, in our previous study on hypertensive patients, the beta index (BI) derived from this method was shown to be less predictive for target organ damage than the systemic stiffness index.2 Speckle tracking echocardiography is a newly developed technique for the assessment of myocardial deformation and has been recently used for the assessment of vascular wall deformation, such as for the abdominal aorta.3,4 Research has also demonstrated decreased aortic circumferential strain (CS) and strain rate (CSR) in old-aged populations.3 Aortic CS acquired by velocity vector imaging of the descending thoracic aorta by transesophageal echocardiography was observed to be significantly correlated with PWV.5 Arterial CS can also be measured for the carotid artery by using velocity vector imaging.6 Finally, a recent study using speckle tracking echocardiography measuring the CS and CSR of the common carotid artery confirmed that this was a sensitive method for the assessment of arterial elastic properties.4
Arterial stiffness indices, such as PWV and augmentation index, are higher in patients with acute stroke.7,8 These indices have been found to be associated with diabetes, hypertension, metabolic syndrome, and serum markers of immune and inflammation in stroke patients.7–9 However, carotid strain has rarely been studied in relationship with stroke.
Arterial strain measured with speckle tracking echocardiography correlates with age.3,4 Yet this method is seldom applied in elderly people who are already at high risk for vascular events. In this study, we measured the CS and CSR of the common carotid artery in the elderly by speckle tracking echocardiography and several arterial stiffness indices from traditional methods. The purposes of this study were (i) to test the usefulness of speckle tracking echocardiography for the assessment of carotid arterial stiffness in the elderly, (ii) to compare the different parameters of arterial stiffness among traditional methods and carotid deformation imaging, and (iii) to determine whether these parameters were associated with previous stokes in the elderly sample.
METHODS
Subjects
The subjects of this study were recruited from a community health survey program and included 100 subjects who were aged ≥60 years. The health survey program is an annual health examination provided by health insurance for subjects with the aged >60 years. Two subjects were excluded because of chronic atrial fibrillation, and 9 subjects were excluded because of inadequate image quality for analysis. The remaining 89 subjects (mean + SD age = 72±6 years; 31 men) were ambulatory and free of acute illness. Medical history and physical examinations were evaluated carefully for all subjects. Previous stroke was defined by hospital admission because of ischemic stroke. Blood pressure was measured immediately before the carotid ultrasound and measurement of PWV. Blood pressure was measured using standard sphygmomanometry method by an experienced nurse. The subjects were measured in a sitting position after at least 5 minutes of rest. Diabetes mellitus was diagnosed if the fasting plasma glucose concentration was ≥ 126mg/dl on 2 separate occasions or if the patient was being treated with insulin or oral hypoglycemic agents. Hypertension was diagnosed if blood pressure was ≥ 140/90mm Hg on 3 occasions or if the patient was taking antihypertensive medication. Dyslipidemia was defined as total serum cholesterol ≥ 200mg/dl, triglyceride ≥ 150mg/dl, or treatment with lipid-lowering therapy. The study was approved by the Research Ethics Committee of our hospital, and informed consents were obtained from all subjects.
Carotid artery ultrasonography
Carotid B-mode images were acquired by using a multifrequency 7.5–10 MHz high resolution vascular probe equipped on an echocardiographic system (Vivid 7; GE-VingMed, Horton, Norway). The probe was kept perpendicular to the far wall of the carotid artery. Bilateral long-axis views of the common carotid arteries up to the carotid bulb were acquired for 3 cardiac cycles to optimize the best visualization of the intima-media complex. Cross sectional images of bilateral common carotid arteries at the level of 1cm below carotid bulb were also acquired for 3 cardiac cycles with a frame rate of 60–90 frames per second. All of the images were stored digitally in RawDICOM format.7 We did not use the compound setting to smooth the tracking to avoid overriding trivial but significant deformation within pulsation. All ultrasonographic images were acquired by the same operator who was blinded to the clinical characteristics of each subject.
Speckle tracking analysis of carotid artery
Offline analysis of the carotid artery was performed on a workstation with the use of speckle tracking software (EchoPac 6.0; GE-VingMed). Cross-sectional images were used for measurement of circumferential deformation of vessel wall. The inner vascular border was manually defined using a point-and-click technique. The region of interest was adjusted manually to cover the entire depth of the vascular wall. The appropriate tracking of the vessel walls was checked visually and automatically by the software. The software selected stable speckles within the arterial wall and tracked these speckles frame by frame throughout the entire cardiac cycle. The software then divided the entire carotid arterial circumference into 6 conventional segments and provided a tracking quality (green = good, red = bad) for each segment. If the tracking was poor, the operator could readjust the region of interest by moving the endothelial lining or by changing its width to achieve a better tracking. After this adjustment, the software would recheck tracking quality. All of the 6 segments with good tracking quality were considered to be satisfactory images. We excluded 9 patients because of unsatisfactory tracking qualities after repeated adjustments. Time-strain and time-strain rate plots were produced automatically by the software. Peak CS and CSR were identified from the global strain or strain rate curve. Time to peak CS (TCS) or time to peak CSR (TCSR) was measured from the beginning of the QRS wave on each electrocardiographic beat to peak CS and to peak CSR, respectively (Figure 1). An average of 3 measurements was taken for analysis. The reproducibility of speckle tracking for carotid artery in our laboratory was tested from 10 random samples. For CS, the intraobserver concordance correlation coefficient (ρ) was 0.96, and the interrater agreement statistic (K) was 0.79; the interobserver ρ was 0.95 and K was 0.72. For CSR, the intraobserver ρ was 0.95 and K was 0.75, and the interobserver ρ was 0.94 and K was 0.77. For TCS, the intraobserver ρ was 0.75 and K was 0.51, and the interobserver ρ was 0.82 and K was 0.64. For TCSR, the intraobserver ρ was 0.90 and K was 0.82, and the interobserver ρ was 0.86 and K was 0.75. The reproducibility of carotid deformation was comparable with that in another study.10
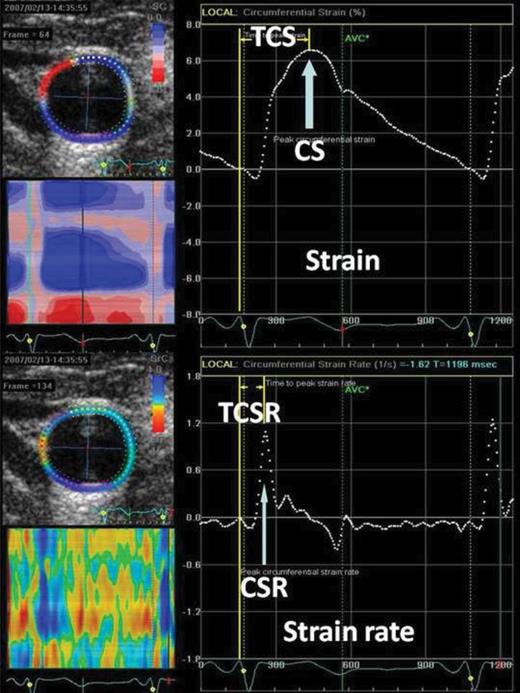
Strain curve (upper panel) and strain rate curve (lower panel) derived from speckle tracking echocardiography on the carotid artery. Peak circumferential strain (CS) (arrow in upper panel) or CSR circumferential strain rate (CSR) (arrow in lower panel) was identified as value of the first upward peak after ventricular systole from the global strain curve or the global strain rate curve, respectively. Time to peak circumferential strain (TCS) (upper panel) or time to peak circumferential strain rate (TCSR) (lower panel) was measured from the beginning of the QRS wave on each electrocardiographic beat to peak CS or to peak CSR, respectively.
Measurements of intima-medial thickness (IMT), BI, and distensibility (DI)
The longitudinal images were analyzed to calculate IMT, defined as thickness of the vascular intima-media complex obtained 1cm below the carotid bulb. IMT was measured at the far wall by using automated border detection software in the workstation (EchoPac 6.0; GE-VingMed). IMT was measured including the inner edge and excluding the outer edge of the double line pattern of the intimal and medial thickness along the carotid artery for 1cm in length. Average values of IMT along this 1-cm segment were used for analysis. Plaque was defined as IMT ≥ 1.1mm at >1 sites.11 Diameter of the carotid artery was measured by M-mode across the center of this longitudinal image, and maximal diameter was measured in systolic phase and minimal diameter in diastolic phase. An average of 3 measurements was used for calculation. BI was calculated as ln(systolic blood pressure/diastolic blood pressure)/(maximal diameter − minimal diameter). DI was calculated as 2(changes in carotid diameter)/(minimal diameter)(pulse pressure).2,12–14
Measurement of PWV
PWV was measured via dual-channel photoplethysmography, which was described in detail in our previous study.1 The pulse wave analysis software used a Visual Basic (Microsoft Corporation, Redmond, WA) interface capable of analyzing 2 digital volume pulses from the right index finger and right second toe simultaneously and also measuring the time difference (i.e., transit time) between the 2 roots of the digital volume pulses. The finger-to-toe distance was the difference from the sternal notch to the right second toe and from the sternal notch to the right index finger. The values of PWV (m/s) were obtained automatically from software calculation of the finger-to-toe distance divided by the transit time, which was validated and shown to have a good correlation with carotid-to-femoral PWV measured by applanation tonometry in our previous work.1 The average of PWV values of consecutive heart beats in 5 seconds was measured automatically by our system.1
Statistics
The average of the bilateral measurements from both carotid arteries was used for analysis. Relationships among different stiffness measurements or clinical characteristics were tested with the Pearson correlation test. Effects of risk factors on stiffness measurements were tested with the Student t test. Differences between the subjects with or without a previous stroke were compared with the Student t test for continuous variables or the χ2 test for categorical variables. Multiple logistic regression analysis was used for independent factors. All data are presented as mean ± SD. A P value < 0.05 was considered to be statistically significant. All analyses were performed with SPSS 13.0 for Windows (SPSS Institute, Chicago, IL).
RESULTS
Effects of risk factors on carotid measurements
The basic data of the study subjects are detailed in Table 1. There were 28 (35%) subjects with hypertension, 12 (14%) subjects with diabetes, and 8 (9%) subjects with dyslipidemia. Regarding medication history, 18 (20%) subjects were using antihypertensive agents, 6 (7%) subjects were using lipid-lowering drugs, and 44 (49%) subjects were using antiplatelet agents. For all subjects, CS was 2.60% ± 1.24%, CSR was 0.45% ± 0.18% 1/s, TCS was 262±61ms, TCSR was 133±25ms, IMT was 0.79±0.15mm, BI was 14.5±9.3, DI was 2.75±1.33 10−6cm2/dyne, and PWV was 9.2±1.4 m/s. Table 2 shows the correlation between clinical characteristics and carotid measurements. CS was significantly and negatively correlated with age, systolic blood pressure, diastolic blood pressure, and fasting blood glucose. CSR was significantly and negatively correlated with systolic and diastolic blood pressure. There was no significant correlation between TCS or TCSR with clinical parameters except for TCS being negatively correlated with fasting glucose level. IMT was significantly correlated with age but negatively correlated with diastolic blood pressure. BI was only significantly correlated with age, and DI was only significantly correlated with systolic blood pressure. PWV was significantly correlated with age, systolic blood pressure, diastolic blood pressure, and serum triglyceride level. After multivariable linear regression analysis, we found CS remained significantly correlated with age (ß = −0.283; r = 0.006), diastolic blood pressure (ß = −0.326; r = 0.031), and glucose (ß = −0.234; r = 0.020). TCSR was significantly correlated with glucose (ß = 0.229; r = 0.043). IMT remained significantly correlated with age (ß = 0.294; r = 0.005) and diastolic blood pressure (ß = −0.414; r = 0.008). BI was significantly correlated with systolic blood pressure (ß = 0.541; r = 0.001) and diastolic blood pressure (ß = −0.498; r = 0.003). DI remained significantly correlated with systolic blood pressure (ß = −0.625; r < 0.001). PWV remained significantly correlated with age (ß = 0.215; r = 0.023), systolic blood pressure (ß = 0.418; r = 0.002), and triglyceride (ß = 0.391; r < 0.001). Sex did not significantly affect carotid measurements. In a comparison of smokers and nonsmokers, only IMT (1.00±0.26 vs. 0.77±0.12mm; P < 0.001) was significantly increased in smokers.
Basic data of study subjects
| Clinical characteristics | |
|---|---|
| Age, years | 72±6 |
| Men, % | 31 (35) |
| Body mass index, kg/m2 | 25.2±6.3 |
| Systolic blood pressure, mm Hg | 137±19 |
| Diastolic blood pressure, mm Hg | 76±13 |
| Glucose, mg/dl | 108±31 |
| Cholesterol, mg/dl | 197±35 |
| Triglyceride, mg/dl | 113±114 |
| Creatinine, mg/dl | 0.81±0.36 |
Data are expressed as mean ± SD or number (%).
Correlation between clinical parameters and measurements of carotid artery
| Carotid artery measurements | Age | Systolic blood pressure | Diastolic blood pressure | Body mass index | Cholesterol | Triglyceride | Glucose |
|---|---|---|---|---|---|---|---|
| CS | r = −0.268* | r = −0.244* | r = −0.288** | r = −0.116 | r = 0.100 | r = −0.188 | r = −0.306** |
| CSR | r = −0.154 | r = −0.315** | r = −0.317** | r = −0.009 | r = 0.041 | r = −0.114 | r = −0.066 |
| TCS | r = −0.150 | r = −0.148 | r = −0.131 | r = −0.169 | r = 0.178 | r = −0.046 | r = −0.267* |
| TCSR | r = −0.064 | r = −0.037 | r = 0.025 | r = −0.129 | r = −0.009 | r = −0.050 | r = 0.204 |
| IMT | r = 0.348** | r = −0.137 | r = −0.334** | r = −0.015 | r = −0.181 | r = −0.011 | r = −0.054 |
| BI | r = 0.316** | r = 0.169 | r = −0.133 | r = 0.005 | r = −0.064 | r = −0.073 | r = 0.199 |
| DI | r = −0.156 | r = −0.442** | r = −0.196 | r = 0.028 | r = 0.064 | r = 0.046 | r = −0.200 |
| PWV | r = 0.227* | r = 0.379** | r = 0.212* | r = −0.043 | r = −0.170 | r = 0.376** | r = 0.138 |
Abbreviations: BI, beta index; CS, circumferential strain; CSR, circumferential strain rate; DI, distensibility; IMT, intima-medial thickness; PWV, pulse wave velocity; TCS, time to peak CS; TCSR, time to peak CSR.
*P < 0.05; **P < 0.01.
Correlation between parameters of the carotid artery
CS was significantly correlated with CSR (r = 0.854; P < 0.001). CS and CSR were significantly correlated with BI and DI, but not PWV. Both BI and DI were significantly correlated with PWV. IMT was only significantly correlated with TCSR (Table 3).
Correlation between measurements of carotid artery
| Carotid artery measurements | CS | CSR | TCS | TCSR | IMT | BI | DI | PWV |
|---|---|---|---|---|---|---|---|---|
| CS | ||||||||
| CSR | r = 0.854** | |||||||
| TCS | r = 0.436** | r = 0.253* | ||||||
| TCSR | r = −0.004 | r = −0.055 | r = 0.379** | |||||
| IMT | r = 0.017 | r = 0.040 | r = −0.195 | r = −0.292** | ||||
| BI | r = −0.308** | r = −0.283* | r = −0.093 | r = 0.121 | r = 0.002 | |||
| DI | r = 0.348** | r = 0.391** | r = 0.047 | r = −0.017 | r = 0.064 | r = −0.675** | ||
| PWV | r = −0.192 | r = −0.195 | r = −0.023 | r = 0.015 | r = 0.057 | r = 0.297** | r = −0.372** |
Abbreviations: BI, beta index; CS, circumferential strain; CSR, circumferential strain rate; DI, distensibility; IMT, intima-medial thickness; PWV, pulse wave velocity; TCS, time to peak CS; TCSR, time to peak CSR.
*P < 0.05; **P < 0.01.
Comparison between subjects with and without a previous stroke history
There were 10 subjects (11%) with a history of hospitalization because of stroke. In comparison between subjects with and without a previous stroke history, stroke subjects had more hypertension. CS and CSR were significantly lower in stroke subjects (Table 4). We used two models for multivariable analysis for independent predictors of a previous stroke. For model 1, controlling for age, heart rate, and systolic blood pressure, we found that cholesterol level (odds ratio (OR) = 1.024, 95% confidence interval (CI) = 1.002–1.046; P = 0.03), CS (OR = 0.249, 95% CI = 0.094–0.665; P = 0.005), and CSR (OR = 0.002, 95% CI = 0.000–0.335; P = 0.02) were independent factors associated with stroke. For model 2, controlling for age, heart rate, systolic blood pressure, and cholesterol level, we found that CS (OR = 0.148, 95% CI = 0.039–0.559; P = 0.005) and CSR (OR = 0.001, 95% CI = 0.000–0.359; P = 0.02) were still independent factors associated with stroke. The area under receiver-operating characteristics curves for diagnosis of stroke was 0.804 for CS and 0.713 for CSR. Using <0.90% as a diagnostic value for CS, the sensitivity was 50% and specificity 92% for the diagnosis of stroke. Using <0.18 1/s for CSR, the sensitivity was 75% and specificity 92%.
Comparison between subjects with or without stroke history
| Characteristics | Stroke history (n = 10) | No stroke history (n = 79) | P value |
|---|---|---|---|
| Age, years | 74±3 | 72±6 | 0.17 |
| Male, % | 4 (40) | 27 (34) | 0.72 |
| Heart rate, beat/min | 74±11 | 75±10 | 0.82 |
| Systolic blood pressure, mm Hg | 142±24 | 136±18 | 0.37 |
| Diastolic blood pressure, mm Hg | 79±13 | 75±13 | 0.36 |
| Body mass index, kg/m2 | 25.3±3.2 | 25.2±6.6 | 0.96 |
| Hypertension, % | 7 (70) | 21 (27) | 0.005 |
| Diabetes, % | 1 (10) | 11 (14) | 0.73 |
| Smoking, % | 0 (0) | 7 (9) | 0.33 |
| Dyslipidemia, % | 1 (10) | 7 (9) | 0.91 |
| Antihypertension medications, % | 4 (40) | 14 (18) | 0.10 |
| Lipid-lowering agents, % | 0 (0) | 6 (8) | 0.37 |
| Antiplatelet agents, % | 10 (100) | 34 (43) | 0.001 |
| Glucose, mg/dl | 112±22 | 108±32 | 0.74 |
| Cholesterol, mg/dl | 216±32 | 195±34 | 0.06 |
| Triglyceride, mg/dl | 197±301 | 102±57 | 0.35 |
| Creatinine, mg/dl | 0.98±0.82 | 0.79±0.25 | 0.11 |
| CS, % | 1.46±0.54 | 2.75±1.23 | 0.002 |
| CSR, 1/s | 0.30±0.13 | 0.47±0.18 | 0.007 |
| TCS, ms | 250±63 | 264±61 | 0.49 |
| TCSR, ms | 125±20 | 134±25 | 0.29 |
| IMT, mm | 0.74±0.12 | 0.79±0.15 | 0.32 |
| Plaque, % | 7 (70) | 49 (62) | 0.62 |
| BI | 10.7±4.4 | 15.0±9.7 | 0.20 |
| DI, 10−6 cm2/dyne | 2.80±1.12 | 2.74±1.74 | 0.90 |
| PWV, m/s | 8.7±2.2 | 9.2±1.3 | 0.29 |
Abbreviations: BI, beta index; CS, circumferential strain; CSR, circumferential strain rate; DI, distensibility; IMT, intima-medial thickness; PWV, pulse wave velocity; TCS, time to peak CS; TCSR, time to peak CSR.
DISCUSSION
Our study indicates that CS and CSR were independently associated with a previous stroke history in our study subjects. Only vascular deformation parameters (CS and CSR) of carotid artery, but not traditional stiffness indices, were predictive factors for stroke in these older subjects. Carotid CS and CSR were significantly correlated with local indices (BI and DI), but not with the systemic stiffness index (PWV).
Our study revealed that the CS and CSR of the carotid artery correlated with risk factors, especially with blood pressure. Whereas age is the major contributor for increased arterial stiffness,15–17 vascular deformation has been less studied in the carotid artery. Tissue Doppler-derived strain and strain rate have been used for the assessment of the carotid artery and have been demonstrated to be significantly correlated with age and the Framingham risk score.18 However, tissue Doppler-derived measurements can only be applied on radial deformation. One small study (10 younger and 10 older subjects) showed that the CS and CRS of the carotid artery using speckle tracking echocardiography were decreased in older subjects (aged >50 years) and radial deformation was not different between the younger and older groups.4 Given that radial strain or strain rate in our study showed no correlation with other parameters and risk factors (data not shown), radial deformation was less useful in the assessment of vascular stiffness.
Our study demonstrated that carotid CS and CSR were significantly correlated with BI and DI but not PWV. This result suggests that carotid CS or CSR can be a local index for carotid artery rather than stiffness of the general arterial tree. A similar study using tissue Doppler-derived strain on the ascending aorta showed that aortic strain was correlated with BI at the aortic root.19 A recent study determined that increased stiffness of elastin, despite a decrease in elastin content and an increase in stiffness of collagen due to increased glycation and changed isoforms of collagen in vessel wall, contributed to the increased local stiffness of the abdominal aorta due to aging.20 Because PWV measured by our system included central and peripheral arteries,1 it is conceivable the measurements would have been different if we had used classical carotid–femoral PWV, which measures major large arteries. BI and DI were more localized to the carotid artery but still retained some characteristics of peripheral arteries because of the use of brachial blood pressure in the calculation. And for the same reason, the significance of CS and CSR in association with stroke did not increase after correction with brachial pulse pressure in our study (data not shown).10 Furthermore, BI and DI measure different directions of vascular motion from CS and CSR. BI and DI also measure radial displacement of the vessel wall, but CS and CSR measure circumferential expansion of the vessel wall. We also used brachial pulse pressure instead of carotid pulse pressure in measuring BI and DI in this study. Given that carotid pulse pressure is different from brachial pulse pressure, it is currently not easy to measure carotid pulse pressure without a special device. One of the benefits of CS and CSR, therefore, is that they do not need pressure measurement, yet can still add value in clinical practice. Although IMT was not correlated with CS and CSR in our study, IMT was negatively correlated with TCS and TCSR. Increased IMT was associated with the shortening of time for circumferential expansion during the ejection of blood into the carotid artery. Decreased time to peak carotid expansion was associated with less CS and contributed to decreased distensibility, which is represented by a smaller slope of the carotid diameter/pressure curve, which was noted in older subjects.21
The prevalence of stroke has been determined to be approximately 10% in elderly Asian populations, which is higher than that in white groups.22 A previous large longitudinal study showed that carotid–femoral PWV was an independent predictor for fatal stroke in middle-aged (mean age = 51 years) hypertensive patients.23 In another study, it was observed that aortic BI measured by transesophageal echocardiography was higher in elderly patients (aged ≥55 years) with ischemic stroke than in the control subjects.24 Increased aortic stiffness might reflect vascular dysfunction in the cerebral circulation, which might help to explain the association between aortic stiffness and stroke. Our study suggests that CS and CSR not only can be used for assessment of local common carotid arterial stiffness but also are associated with previous stroke in older subjects (aged ≥60 years). The fact that global indices did not show a significant association with stroke in our study was probably because the age of the sample was greater than that in previous studies. PWV and BI were already increased in these aging people, making it difficult to see differences in their measurements between patients with and without stroke history. Carotid deformation was thus a better method of risk stratification for stroke in older subjects who already had higher arterial stiffness. A recent study by Yang et al. suggested that strain measured by speckle tracking was more sensitive than that measured by distensibility.25 This is one of the possible reasons why CS and CSR, but not BI and DI, were associated with a previous stroke in our study. Another possible explanation why BI, DI, and PWV did not show significant differences between groups was that 70% of the stroke subjects had hypertension. Because vascular compliance is reduced with high pressure, it is not clear if the correlation is in fact causative or simply associated with higher blood pressure.
There were several limitations in our study. Image quality is vital for deformation analysis. We excluded 9 patients (8%) because of inadequate imaging in this study. Also, because subjects of this study were from a community health survey program and all of the subjects were voluntary and ambulatory, some subjects with severe disability resulting from stroke might not have been included in our study. For this reason, the rate of stroke might have been possibly underestimated in this study. Furthermore, diagnosis of stroke was based on a history review of stroke hospitalization, and we might have omitted some patients with transient ischemic attack in this study. Because this study was a cross-sectional study, the association between carotid deformations with stroke should be further evaluated by a large longitudinal study. Interestingly, IMT was negatively correlated with diastolic blood pressure in this study, a finding that is difficult to explain. We surmise that it was probably because of the influences of antihypertensive medications. Not having a supine measurement of blood pressure at the time of the study might be a limitation, because position of blood pressure measurement could have affected the results of carotid strain, BI, and DI. The measurements would also have been different if we had used carotid blood pressure instead of brachial blood pressure. However, using brachial blood pressure probably would not be a concern in the disease state in light of reports that have suggested that central and peripheral blood pressure are similar in states of disease and mainly different in healthy individuals.26 Finally, the IMT values were relatively lower in our study than in a previous study in asymptomatic Taiwanese people, in which IMT was found to be approximately 0.8mm in subjects aged >60 years.27 This difference was likely because of low number of case subjects and a different subject population in our study.
Carotid CS and CSR can be obtained by speckle tracking echocardiography and represented as indices for local arterial stiffness. CS and CSR were found to be independently associated with previous stroke in the elderly. Carotid ultrasonography can not only be used for morphology evaluation of the carotid artery but can also measure local arterial stiffness by using speckle tracking analysis.
DISCLOSURE
The authors declared no conflict of interest.
ACKNOWLEDGMENTS
This work was supported by grants NSC 100-2314-B-006-064 and NSC 101-2314-B-006-074 from the National Science Council, Executive Yuan, Taipei, Taiwan.
REFERENCES
