Article Text

Abstract
Introduction Patients who had a mild ischaemic stroke who present with subtle or resolving symptoms sometimes go undiagnosed, are excluded from treatment and in some cases clinically worsen. Circulating immune cells are potential biomarkers that can assist with diagnosis in ischaemic stroke. Understanding the transcriptomic changes of each cell population caused by ischaemic stroke is critical because they work closely in a complicated relationship. In this study, we investigated peripheral blood mononuclear cells (PBMCs) transcriptomics of patients who had a stroke using a single-cell RNA sequencing to understand peripheral immune response after mild stroke based on the gene expression in an unbiased way.
Methods Transcriptomes of PBMCsfrom 10 patients who had an acute ischaemic stroke within 24 hours after stroke onset were compared with 9 race-matched/age-matched/gender-matched controls. Individual PBMCs were prepared with ddSeqTM (Illumina-BioRad) and sequenced on the Illumina NovaSeq 6000 platform.
Results Notable population changes were observed in patients who had a stroke, especially in NK cells and CD14+ monocytes. The number of NK cells was increased, which was further confirmed by flow cytometry. Functional analysis implied that the activity of NK cells also is enhanced in patients who had a stroke. CD14+ monocytes were clustered into two groups; dendritic cell-related CD14+ monocytes and NK cell-related CD14+ monocytes. We found CD14+ monocyte subclusters were dramatically reduced in patients who had a stroke.
Discussion This is the first study demonstrating the increased number of NK cells and new monocyte subclusters of mild ischaemic stroke based on the transcriptomic analysis. Our findings provide the dynamics of circulating immune response that could assist diagnosis and potential therapeutic development of mild ischaemic stroke.
- stroke
- inflammatory response
- ischaemic attack
- transient
Data availability statement
Data are available upon reasonable request.
This is an open access article distributed in accordance with the Creative Commons Attribution Non Commercial (CC BY-NC 4.0) license, which permits others to distribute, remix, adapt, build upon this work non-commercially, and license their derivative works on different terms, provided the original work is properly cited, appropriate credit is given, any changes made indicated, and the use is non-commercial. See: http://creativecommons.org/licenses/by-nc/4.0/.
Statistics from Altmetric.com
Introduction
Stroke is the fifth leading cause of death in the USA and remains a serious disability for adults.1 2 Early and accurate detection of an ischaemic insult is paramount to initiating an appropriate acute intervention and strategies for preventing recurrence. At present, the diagnosis of stroke mostly remains based on clinical evaluation and neuroimaging assessment.3 Diagnosis is confounded by variability in the imaging modality used and in the uncertainty in the causal relationship between specific findings and clinical presentation. Due to these risks, there is a need for biomarkers linked directly to the biology of cerebral ischaemia that can assist with diagnosis in this vulnerable population.
Peripheral immune cells are potential surrogate biomarkers in ischaemic stroke.4 5 Compared with images in a narrow time frame after stroke, it allows us to evaluate disease progression and predict outcomes in a more timely manner.6 Among circulating immune cells, monocytes have been tested as potential biomarkers. It was found that each monocyte subtype correlates with stroke severity or associated infections,7 and monocyte-to-high-density lipoprotein ratio and lymphocyte-to-monocyte ratio are related to patient outcome and stroke severity in patients who had an ischaemic stroke.8 T-cell immunoglobulin and mucin domain containing 4 (TIM-4) expression level in non-classical monocytes was significantly increased in patients who had a stroke compared with controls and correlated with National Institutes of Health Stroke Scale (NIHSS) scores.9 Circulating natural killer (NK) cells are another candidate of biomarkers in ischaemic stroke. A higher number of circulating NK cells and a low level of interferon gamma (IFN-γ) or perforin expression of NK cells were suggested to be used to predict a higher chance of poststroke infection.10 11
However, peripheral immune response after stroke is complex because various immune cells behave in different directions and interplay with each other.12 Sometimes, their behaviour pattern does not match surface markers that we use to differentiate cells.13 Therefore, in order to develop peripheral immune cell biomarkers in ischaemic stroke, we first need to have a comprehensive understanding of the dynamics of each immune cell caused by stroke incidence. In this study, we implemented single-cell RNA sequencing (scRNA-seq) to obtain an unbiased and broad understanding of systemic immune response after stroke in peripheral blood mononuclear cells (PBMCs). We investigated the characteristics of each cell population of PBMCs from patients who had a stroke compared with controls and found significant changes in NK cells and monocytes of patients who had a stroke.
Materials and methods
Subjects
Patients presenting to the emergency department at Suburban Hospital in Bethesda Maryland who are within 24 hours of last known well and with clinical and imaging findings were included in this study. Once written informed consent was obtained, peripheral blood was drawn. All patients were seen by the National Institutes of Health acute stroke team and evaluated as part of their standard care. The severity of neurological symptoms was scored on NIHSS.
Flow cytometry
PBMCs were measured with an eight-colour immunophenotyping kit and a flow cytometer, MACSQuant Analyzer 10 (Miltenyi Biotec, Bergisch Gladbach, Germany). A cocktail of fluorochrome-conjugated recombinant engineered REAfinity antibodies was used for cell staining: CD3 conjugated to PE, CD4 conjugated to VioBright 667, CD8 conjugated to APC-Vio 770, CD14 conjugated to VioBlue, CD16 conjugated to VioBright 515, CD19 conjugated to PE-Vio 770, CD45 conjugated to VioGreen and CD56 conjugated to VioBright 515. Gating and analysis of flow cytometry data were performed with FlowJo (Treestar, San Carlos, California, USA).
Single-cell RNA sequencing
Within 2 hours after blood draw, PBMCs were isolated using SepMate, Lymphoprep and EasySep Buffer (STEMCELL Technologies, Vancouver, Canada). Detailed procedures were followed using the manufacturer’s direction. Isolated PBMCs were stored at −80°C until used. Frozen PBMCs were thawed at 37°C then centrifuged at 300×g for 3 min at 4°C. PBMCs were adjusted to be 3000 cells/µL with EasySep Buffer. Illumina Bio-Rad SureCell WTA 3′ Library Prep Kit (Illumina, San Diego, California, USA), along with ddSeq system (BioRad, Hercules, California, USA) were used for the library preparation process. All libraries were sequenced on NovaSeq 6000 (Illumina, San Diego, California, USA).
Single-cell RNA-seq analysis
Unique molecular identifiers were obtained from FASTQ files using SureCell RNA Single-Cell App V.1.2 in BaseSpace. Alignment was performed on University of California Santa Cruz (UCSC)’s hg38 reference genome using STAR V.2.5.2b.14 Clustering and differential gene expression analysis per cell type were performed using Seurat V.3.0.0.15 16 A Seurat object was constructed per subject from the filtered count table obtained from BaseSpace. Seurat objects were merged, normalized with natural log and scaled by a default scaling factor of 10000 each for stroke subjects and for control subjects. Two thousand genes whose expressions vary from cell to cell were identified. Integration anchors were identified using the first 30 principal axes in Canonical Correlation Analysis. Rescaling was performed to make the mean value of 0 and standard deviation of 1. Principal component analysis (PCA), t-distributed stochastic neighbor embedding (t-SNE) and uniform manifold approximation and projection (UMAP) clustering were performed. Neighbouring cells were found using the first 30 principal axes from PCA, and followed by clustering assignment.
Statistics
The relative cell composition between patients who had a stroke and controls was compared with the Mann-Whitney U test with a statistical threshold as p=0.05 using SPSS V.27. Ingenuity pathway analysis (Qiagen, Hilden, Germany) and Enrichr were used to analyse network interactions among differentially expressed genes (DEGs) and perform the functional enrichment analysis of these DEGs.17,18 The most significant core network and the canonical pathways were identified within the gene sets. All plots were generated using GraphPad Prism V.7 (GraphPad Software, La Jolla, California, USA).
Results
Distinctive transcriptomic profiles in PMBC between patients who had a stroke and controls
PBMCs were isolated from the whole blood obtained from patients who had a stroke and controls (figure 1A). Ten patients who had an ischaemic stroke (four women, 68.8±13.1 years old, and all Caucasian) were included. The median NIHSS score was 1.5 at admission (IQR 0–4). All other demographic characteristics of patients who had a stroke are described in table 1. The control group consists of the age-matched and sex-matched healthy subjects (n=9), four women; the mean age is 59.1±16.8 years old and all are Caucasian.
Characteristics of patients who had a stroke
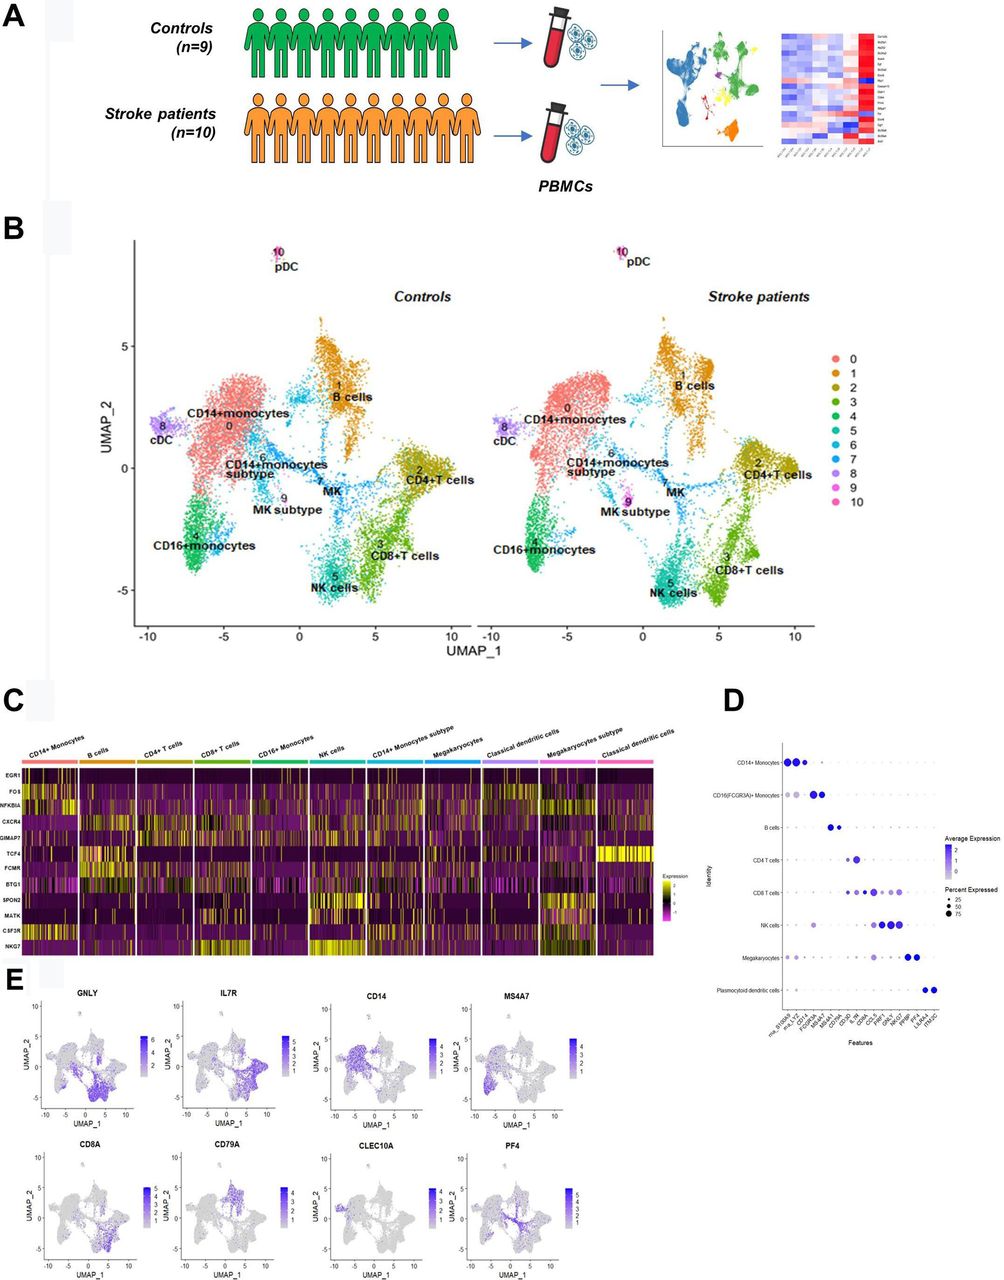
Study design and transcriptome profiling of PBMCs from controls and patients who had a stroke. (A) Schematic picture showing the overall study design; PBMCs were pulled from controls (n=9) and patients who had an acute ischaemic stroke (n=10), and single-cell RNA sequencing was performed. (B) Cell clusters were identified with UMAP projection of 101 481 cells from controls and patients who had a stroke. (C,E) Selected canonical cell markers were used to identify cell clusters. cDC, classical dendritic cell; MK, megakaryocyte; NK, natural killer; PBMC, peripheral blood mononuclear cell; pDC, plasmacytoid dendritic cell; UMAP, uniform manifold approximation and projection.
After quality control, we analysed 93 713 genes from 12 156 cells of patients who had a stroke (n=10), and 89 325 genes from 14 146 cells of controls (n=9). Individual cell numbers analysed are shown in figure 2A. Most of the clusters contained cells from all participants, and replicates from the same patient demonstrated a tight correlation between two runs (r=0.98, online supplemental figure 1A,B). Using graph-based clustering of UMAP, we identified 11 cell clusters (figure 1B) in each subject based on the expression of canonical marker genes (figure 1C–E). Identified cell clusters and marker genes are CD14+ monocytes clusters (S100A9, LYZ and CD14), B cells (MS4A1 and CD79A), CD4+ T cells (CD3D and IL7R), CD8+ T cells (CD8A), CD16+ monocytes (FCGR3A and MS4A7), NK cells (GNLY and NKG7), megakaryocytes and megakaryocytes subtype cluster (PPBP and PF4), classical dendritic cells (CD1c and CLEC10A) and plasmacytoid dendritic cells (LILRA4, ITM2C, JCHAIN and PTPRS). The CD14+ monocytes were distributed across two clusters, which we named CD14+ monocytes (a bigger cluster) and CD14+ monocytes subtype (a smaller cluster). Comparing the two clusters, CD14+ monocytes cluster expressed a strong unique signature of marker genes of CD14+ monocytes described previously, whereas in the CD14+ monocytes subtype cluster, the expression pattern of CD14+ monocyte marker genes was not as strong as in CD14+ monocytes cluster.
Supplemental material

Differences in NK cell population between controls and patients who had a stroke. (A) Top dot plot shows the total PBMC counts of each subject used in scRNA-seq. The bar plot shows the percentage of cell clusters in each subject. The average percentage of each cell cluster analysed using scRNA-seq (B) and flow cytometry (C) is shown in green for controls and orange for patients who had a stroke. From both scRNA-seq and flow cytometry, it is demonstrated that NK cell cluster is increased in patients who had a stroke. (D) Representative flow cytometry plot shows increased NK cell population in patients who had a stroke. (E) DEGs (adjusted p<0.05) in NK cell clusters of patients who had a stroke compared with controls are demonstrated using a heatmap. (F) Ingenuity pathway analysis was performed with all DEGs in the NK cell cluster, demonstrating enhanced NK cell signalling. (G) Pathway analysis was performed with upregulated DEGs (orange) and downregulated DEGs (blue) of the NK cell cluster. Upregulated DEGs are involved in the activation of the NK cell-related pathway. cDC, classical dendritic cell; DEG, differentially expressed gene; MK, megakaryocyte; NK, natural killer; PBMC, peripheral blood mononuclear cell; pDC, plasmacytoid dendritic cell; scRNA-seq, single-cell RNA sequencing; PKR, Protein Kinase R; STAT3, Signal Transducer and Activator of Transcription 3; MAPK, Mitogen-Activated Protein Kinase.
To investigate the changes of the cell cluster composition of patients who had a stroke, we analysed the relative percentage of cell clusters by individual subjects and groups (figure 2A,B). CD14+ monocyte cluster was the biggest cluster in both groups (25.0% in controls and 24.0% in patients who had a stroke), and CD14+ monocyte subtype cluster was significantly reduced in patients who had a stroke as compared with controls (3.8% in patients who had a stroke and 9.4% in controls). The proportion of NK cell cluster also changed, showing a significant increase in patients who had a stroke (11.6%) compared with controls (6.2%, p=0.022). The relative percentage of other clusters are as follows: CD4+ T-cells cluster is 11.8% in controls and 14.3% in patients who had a stroke; CD8+ T-cells cluster is 12.7% in controls and 12.7% in patients who had a stroke; CD16+ monocytes cluster is 10.3% in controls and 8.1% in patients who had a stroke; B-cells cluster is 13.6% in controls and 14.2% in patients who had a stroke; megakaryocytes cluster is 6.4% in controls and 4.8% in patients who had a stroke; megakaryocytes subtype cluster is 0.1% in controls and 3.0% in patients who had a stroke; classical dendritic cells cluster is 3.6% in controls and 2.8% in patients who had a stroke; and plasmacytoid dendritic cells cluster is 1.0% in controls and 0.8% in patients who had a stroke (online supplemental table 1).
Supplemental material
We also tested the cell composition using flow cytometry (figure 2C). Results obtained by measuring the conventional surface markers showed a similar pattern in the cell composition changes of patients who had a stroke; however, it was not the same. First, the NK cell population was significantly increased in patients who had a stroke (8.3% in controls and 15.0% in patients who had a stroke, p=0.025). Figure 2D is the representative figure showing the increased NK cell population in a patient who had a stroke. The monocyte population, especially the classical monocyte population (CD14++/CD16−), was reduced in patients who had a stroke (22.7% in controls and 17.2% in patients who had a stroke). The relative composition of CD4+ T cells and CD8+ T cells were decreased in patients who had a stroke (33.1% in controls and 25.2% in patients who had a stroke of CD4+ T cells, and 8.8% in controls and 2.2% in patients who had a stroke of CD8+ T cells), which was not consistent with scRNA-seq results. Detailed results are shown in online supplemental table 2.
Increased numbers and enhanced activity of NK cells in ischaemic stroke
We further analysed the NK cell cluster by comparison of transcriptome expression patterns of patients who had a stroke with controls. First, we obtained the top 20 DEGs of NK cells (table 2 and figure 2E). Among the top 20 DEGs in the NK cell cluster, only two genes (CX3CR1 and GIMAP7) were upregulated in patients who had a stroke, while 18 DEGs were downregulated, such as CXCR4, DUSP2 and IL7R. The top five canonical pathways of all DEGs (n=71) of NK cells include NK cell signalling, PKR in interferon induction and p38 MAPK signalling, indicating an enhanced NK cell activity in stroke. The glucocorticoid receptor signalling is the strongest canonical pathway, although no direct patterns were found among DEGs (figure 2F). The leading network among DEGs of the NK cell cluster consisted of upregulated FAS ligand (FASL) and downregulated NFκB inhibitor alpha (NFκBIA), supporting our evidence that NK cell activity is enhanced (online supplemental figure 2). Pathway analysis with upregulated DEGs in the NK cell cluster of patients who had a stroke also demonstrated activated NK cell signalling. CX3CR1, DENND2D, PLEKHF1, CD300A, SH2D1A, GNAI3, FASLG, AOAH, GIMAP6, GIMAP7, MYOM2 SYNE2, IL18RAP, ABI3, NCAM1, ADAM8 and PTGDR were involved in the pathway (figure 2G, orange bars).
Differentially expressed genes in natural killer cell cluster
Characterisation of CD14+ monocytes subclusters
We found two distinctive CD14+ monocyte clusters, and the proportion of the CD14+ monocyte subtype cluster was significantly reduced in patients who had a stroke. To characterise detailed changes of CD14+ monocyte transcriptomes in patients who had a stroke, we reanalysed 8701 cells of two CD14+ monocyte clusters; first, we named the larger cluster CD14+ monocyte A and the smaller cluster CD14+ monocyte B. The total number of cells for cluster A and cluster B from scRNA-seq were 6631 and 2070 cells, respectively; specifically, the 6631 cells of cluster A were composed of 2952 cells of patients who had a stroke and 3679 cells of controls, and the 2070 cells of the cluster B were composed of 536 cells of patients who had a stroke and 1534 cells from controls. Fourteen clusters were identified in the UMAP (figure 3A). The cluster A was classified into nine subclusters (0, 2–4 and 6–10). Among nine subclusters obtained, the largest cluster (0) expressing upregulated KLF10, NLRC5 and ISG15, was significantly reduced in patients who had a stroke. Other clusters including subclusters 2, 3, 7 and 8 shared the dendritic cell features; subcluster 2 expressed PGD, CRIP1, XIST and TMEM176B. Subclusters 3 and 7 showed the distinctive expression of major histocompatibility complex (MHC) molecules (eg, HLA. DPA1, DPB1, DQB1, DRA and DRB1) and the increased cell numbers in patients who had a stroke (online supplemental figure 3). Especially, subcluster 7 showed a marked expression of FCGR3A, the marker gene of CD16+ monocytes; thus, it is likely an intermediate monocyte (CD14++CD16+) cluster. Subcluster 8 expressed interferon-related genes, such as IFI44, IFI44L, IFI6, IFIT1/2, IFIT3 and IFITM3, and its proportion was not changed in patients who had a stroke. Subcluster 9 showed a gene expression signature related to the neurological disorder including BDNF signalling pathway and spinal cord injury (online supplemental figure 4). EGR1/2, PTGS2, FOS, FOSB, DUSP1, IER2, ZFP36 and BTG2 were highly expressed in this cluster. Subclusters 6 and 10 were classified due to the expression of erythrocyte progenitor cells (HBB and HBA1/2) and megakaryocyte-related genes (PPBP and PF4), respectively. Based on these signatures, we named subclusters 0, 2–4, 7 and 8 as a dendritic cell-related CD14+ monocyte cluster.

Changes of monocytes subclusters in patients who had a stroke. (A) Two CD14+ monocytes clusters were classified into 14 subclusters; CD14+ monocyte cluster A is classified into nine subclusters (0, 2–4 and 6–10), and CD14+ monocyte cluster B is classified into five subclusters (1, 9 and 11–13). (B) Based on the gene expression characteristics, cluster A is named dendritic cell-related CD14+ monocyte cluster (subclusters 0, 2–4, 7 and 8 in a circle in peach) and cluster B is named NK cell-related CD14+ monocyte cluster (subclusters 1, 9 and 11–13 in a circle in cyan). Besides, there is one plasma cell-related cluster (5), one erythrocyte progenitor cell-related cluster (6) and one megakaryocyte-related cluster (10). (C) The violin plot shows specifically expressed genes of each subcluster using classification. (D) The proportion of each subcluster was compared between controls and patients who had a stroke. (E) Individual variations of each subcluster in controls and patients who had a stroke are shown. Horizontal lines represent the average value for the proportion of each subcluster. *Significant differences (p<0.05) between controls and patients who had a stroke. NK, natural killer; UMAP, uniform manifold approximation and projection.
CD14+ monocyte cluster B was classified into five subclusters (1, 5 and 11–13). Subcluster 1 was significantly reduced in patients who had a stroke, whereas the population of other clusters, including 11–13, was increased. Subclusters 1, 11 and 12 shared a cytokine signature such as GZMA/B, PRF1, NKG7, IFITM1, KLRD1, GNLY, CDL5 and CD247. Particularly subcluster 1 showed a marked expression of CD8A. Subcluster 5 expresses plasma cell-related genes such as MS4A1 and HLA.DQA1. Subcluster 13 expressed a CD4+ T-cell signature, including CD3D and IL7R. Based on the overall signatures, we named clusters 1, 9 and 11–13 as a NK cell-related CD14+ monocyte cluster. The most enriched canonical pathway of both CD14+ monocytes was EIF2 signalling, which was significantly inhibited in patients who had a stroke.
Discussion
After an acute ischaemic stroke incidence, immune system dynamics change very fast and influence clinical progress significantly. Gene expressions of peripheral immune cells are correlated with the disease status of the brain after stroke; thus, it has been suggested as potential biomarkers aiding diagnosis of mild ischaemic stroke. In this study, we provided the dynamics of both cell population and gene expression of PBMCs after mild ischaemic stroke for a comprehensive understanding of the peripheral immune response.
NK cells play a role as a first-line defence against infected or transformed cells and mediate inflammatory responses by releasing cytokine and chemokine.19 In ischaemic stroke, NK cells are infiltrated extensively to the affected brain lesion; however, it is unclear how circulating NK cells behave over time after stroke. Studies have reported inconsistent results in changes of peripheral NK cells population due to the multiple factors such as different patient severity and the time of blood draw,20 however, there is a consensus that the cytokines secreted by circulating NK cells change significantly after ischaemic stroke.20 In our study, the number of NK cell population was increased in patients who had a stroke, which was confirmed from both analyses using transcriptomics and cell surface markers. It might be caused by the fact that our study samples were collected in the acute stage after stroke incidence from patients who had a relatively mild stroke. Previous studies showed that in patients who had a mild to moderate stroke, the percentage of circulating NK cells was slightly increased at day 7.21 However, in patients who had a moderate to severe stroke, the percentage of circulating NK cells was not changed significantly11 or decreased22 after stroke. Decreased NK cell population is involved in reducing the cytokine level in blood. Cytokine deficiency in blood of patients who had an ischaemic stroke is known to contribute to immunodepression causing poststroke infection.23 It is a critical complication resulting in the unfavourable outcomes of ischaemic stroke, and previous reports have shown that NK cells are involved in this process.20 23 The recent preclinical study demonstrated that the risk of poststroke infection is increased when stroke severity is high.24 Increased circulating NK cell population in the early stage of mild ischaemic stroke might prevent occurrence of poststroke infection by producing more cytokines. Indeed, in our study, the pattern of glucocorticoid receptor signalling, one of the main mechanisms of immunosuppression,25 is not clearly defined in the pathway analysis of NK cells. A longitudinal study needs to be followed to understand the precise role of NK cells in mild ischaemic stroke and immunodepression.
In this study, the overall gene expression in NK cells in patients who had a stroke was changed significantly, showing a strong trend of increased cell activity. IFN-p38 MAPK–Nuclear factor kappa B (NFκB) pathway was the primary signalling cascade of activated NK cells. Generally, NFκB activation induces a proinflammatory and proapoptotic response.26 In ischaemic stroke, NFκB signalling is involved in an acute response playing a role in blood–brain barrier disruption, inflammation and neuronal cell death.27 NFκB activity is also associated with stroke severity because the stroke size was reduced with inhibition of NFκB in the animal model28 and in patients who had a stroke.29 Given its role in ischaemic stroke, the NFκB pathway has been suggested as a therapeutic target of ischaemic stroke.30 Our results suggest that the NFκB pathway of NK cells would be a more specific target for mild ischaemic stroke treatment. Furthermore, we found that most DEGs in NK cells were downregulated in patients who had a stroke, although the overall activity is enhanced. It suggests that a post-transcriptional or post-translational modification might be involved in the underlying mechanism.31 miRNAs such as miR-451a or miR-122–5p were suggested to modulate NK cell activity after ischaemic stroke.32 Long-non-coding RNAs are other candidates to modulate NFκB activity in the ischaemic condition.33 Detailed signalling mechanism needs to be investigated further to develop the therapeutic target in NK cells of ischaemic stroke.
Historically, monocytes were classified into three subtypes: classical (CD14++/CD16−), intermediate (CD14++/CD16+) and non-classical monocytes (CD14+/CD16++); however, transcriptomic studies have shown that monocyte subsets represent stages in a developmental sequence as classical monocytes differentiate into intermediate and non-classical monocytes.34 35 In the pathological condition, transcriptomic changes are more complex due to an active interaction with other immune cells.6 Thus, recently studies have tried to classify monocytes according to their transcriptomic characteristics using an scRNA-seq technology (e.g., MONO1-4).36 In this study, we found three different monocyte clusters based on the transcriptomic analysis: dendritic cell-related CD14+ monocyte cluster, NK cell-related CD14+ monocyte and CD16+ monocyte cluster. The overall transcriptomic changes of monocytes in patients who had a stroke towards inactivity given the strongly inhibited EIF2 signalling. However, one of the subclusters has a profile of DEGs that was relevant to the neurological disorder, because each cluster has different characteristics with a different timeline of activation. We suggest that DEGs of this cluster have potentials to be developed as prognostic or diagnostic biomarkers of ischaemic stroke or its therapeutics. In addition, we found CD14+ monocyte subclusters that were significantly reduced in patients who had a stroke. Because these clusters express cytokine-related genes including KLF10, NLRC5, ISG15 and CD8A, it might be explained that this phenomenon is caused by the direct or indirect interaction of monocytes and NK cells37 38 during an immune system disruption such as ischaemic stroke. These are the biggest subclusters in the CD14+ monocyte population; thus, further in-depth studies need to be performed to elucidate their roles in mild ischaemic stroke.
Our study has several limitations. First, subjects were recruited from one centre and all were Caucasian, which allows us to avoid an influence caused by race in the small-sized pilot study. In addition, we observed only one time point, although it is known that circulating immune cells dynamically change over time. However, we could observe the immediate immune response after the stroke event. Finally, although all patients of this study were diagnosed with a minor stroke, they are in various stages of ischaemic stroke and treatment. Findings might need to be interpreted carefully. Future studies enrolling a diverse subject population with longitudinal sample collections including homogenous clinical outcomes may help develop biomarkers to evaluate or predict patients' conditions.
Circulating immune cell dynamics are as critical as the ischaemic response in the brain after stroke because it can be developed as diagnostic biomarkers and therapeutic drugs. Our study provided a comprehensive view of peripheral immune response in mild ischaemic stroke. We suggest that NFκB signalling in the NK cell population would be target therapeutic biomarkers of mild ischaemic stroke. Further, we suggest three different monocyte subgroups based on the transcriptome characteristics. Our transcriptome atlas of peripheral immune cells in patients who had a stroke will provide insights for future studies to discover blood biomarkers of ischaemic stroke, which assist diagnosis and guide treatment.
Data availability statement
Data are available upon reasonable request.
Ethics statements
Patient consent for publication
Ethics approval
This study involves human participants and was approved by patients presenting to the emergency department at Suburban Hospital in Bethesda Maryland. Patients are a subset from an ongoing protocol, Natural History of Stroke Study in Suburban Hospital, approved by the National Institutes of Health (NIH) institutional review board (IRB) (NCT00009243). Blood samples from healthy donors to be used as controls were obtained through the NIH blood bank under an approved IRB protocol (NCT00001846). Participants gave informed consent to participate in the study before taking part.
Acknowledgments
We thank all patients and their families for participating in the research, and the NIH Stroke Team at Suburban Hospital for the care of the patients and collection of data.
References
Supplementary material
Supplementary Data
This web only file has been produced by the BMJ Publishing Group from an electronic file supplied by the author(s) and has not been edited for content.
Footnotes
Contributors Y-EC contributed to the acquisition and interpretation of the data, and drafted and revised the manuscript; HL contributed to the data acquisition and revised the manuscript; HB contributed to the revision of the manuscript; HK contributed to the the data acquisition, interpretation of data and revision of the manuscript; SY contributed to the analysis and interpretation of data and revision of the manuscript; RV contributed to the data acquisition; AC contributed to the the design of the project and revision of the manuscript; MJR contributed to the sample collection at the hospital; MA contributed to the management of the clinical study and revision of the manuscript; LL contributed to the the design of the project and revision of the manuscript; JG contributed to the design of the project and revision of manuscript.
Funding This research was supported by the Intramural Research Program of the National Institutes of Health/National Institute of Neurological Disorders and Stroke and National Institute of Nursing Research (NIH ZIANS003043 and NIH ZIANR000015).
Competing interests None declared.
Provenance and peer review Not commissioned; externally peer reviewed.
Supplemental material This content has been supplied by the author(s). It has not been vetted by BMJ Publishing Group Limited (BMJ) and may not have been peer-reviewed. Any opinions or recommendations discussed are solely those of the author(s) and are not endorsed by BMJ. BMJ disclaims all liability and responsibility arising from any reliance placed on the content. Where the content includes any translated material, BMJ does not warrant the accuracy and reliability of the translations (including but not limited to local regulations, clinical guidelines, terminology, drug names and drug dosages), and is not responsible for any error and/or omissions arising from translation and adaptation or otherwise.