Article Text

Abstract
Background and purpose Previous studies have reported about inflammation processes (IPs) that play important roles in aneurysm formation and rupture, which could be driven by blood flow. IPs can be identified using aneurysmal wall enhancement (AWE) on high-resolution black-blood MRI (BB-MRI) and blood flow haemodynamics can be demonstrated by four-dimensional-flow MRI (4D-flow MRI). Thus, this study investigated the associations between AWE and haemodynamics in unruptured intracranial aneurysms (IA) by combining 4D-flow MRI and high-resolution BB-MRI.
Materials and methods Between April 2014 and October 2017, 48 patients with 49 unruptured IA who underwent both 4D-flow MRI and high-resolution BB-MRI were retrospectively included in this study. The haemodynamic parameters demonstrated using 4D-flow MRI were compared between different AWE patterns using the Kruskal-Wallis test and ordinal regression.
Results The results of Kruskal-Wallis test showed that the average wall shear stress in the IA (WSSavg-IA), maximum through-plane velocity in the adjacent parent artery, inflow jet patterns and the average vorticity in IA (vorticityavg-IA) were significantly associated with the AWE patterns. Ordinal regression analysis identified WSSavg-IA (p=0.002) and vorticityavg-IA (p=0.033) as independent predictors of AWE patterns.
Conclusion A low WSS and low average vorticity were independently associated with a high AWE grade for IAs larger than 4 mm. Therefore, WSS and average vorticity could predict AWE and circumferential AWE.
- aneurysm
- inflammation
- MRI
- vessel wall
Data availability statement
Data are available upon reasonable request. Anonymized data will be shared by request from any qualified investigator.
This is an open access article distributed in accordance with the Creative Commons Attribution Non Commercial (CC BY-NC 4.0) license, which permits others to distribute, remix, adapt, build upon this work non-commercially, and license their derivative works on different terms, provided the original work is properly cited, appropriate credit is given, any changes made indicated, and the use is non-commercial. See: http://creativecommons.org/licenses/by-nc/4.0/.
Statistics from Altmetric.com
INTRODUCTION
Intracranial aneurysm (IA) is a serious neurovascular disease with a 4% prevalence in the general population worldwide.1 The average rupture risk of IA has been reported to be 0.95%,2 IA rupture is the leading cause of non-traumatic subarachnoid haemorrhage, which has a mortality of around 50%.3
Studies have identified a correlation between the invasion of inflammatory cells into the aneurysm wall and aneurysm rupture.4–6 Aneurysmal wall enhancement (AWE) has been used as a surrogate marker to evaluate IA inflammation processes (IPs).7 In contrast, haemodynamic forces, such as low wall shear stress (WSS), are thought to play a key role in IA wall deterioration.8 It has been hypothesised that IPs may vary according to the haemodynamic conditions.9 Pathologically, Turjman et al reported that local blood flow can drive the activity of inflammatory cells.9 Using computational fluid dynamic simulations, several previous studies have reported that the enhanced area in the aneurysm wall tended to have a lower WSS.10–12 However, existing studies on the pathophysiology or simulations of aneurysm blood flow are limited, and there are controversies regarding unreal and uncertain intra-aneurysm flow.10 13 Therefore, it is essential to directly observe the features of AWE and haemodynamic characteristics of IAs in vivo with advanced imaging techniques in patients with IA.
Recent studies have reported that high-resolution black-blood MRI (BB-MRI) can be used for identification of AWE of IAs.14–16 Moreover, four-dimensional-flow MRI (4D-flow MRI), which combines time-resolved 3D phase-contrast MRI with postprocessing strategies, can provide more versatile and comprehensive characterisation of patient-specific haemodynamic parameters in IAs.13 17 18 To the best of our knowledge, no published investigations have revealed the association between AWE grades (evaluated using BB-MRI) and haemodynamic characteristics identified using 4D-flow MRI. Thus, it is prudent to identify the relationship between them to comprehensively understand the pathological mechanism and provide new information to predict IA ruptures.
Therefore, this study aimed to investigate the interaction between AWE and haemodynamics in a large group of patients with IA using high-resolution BB-MRI and 4D-flow MRI techniques.
Methods
Study population
Patients with unruptured saccular IA >4 mm, detected using digital subtraction angiography/CT angiography/magnetic resonance angiography, were recruited between April 2014 and October 2018. We excluded the following patients: (1) who had contraindications for MRI, including pregnancy or breastfeeding, claustrophobia and existence of MRI-incompatible implants, (2) who had a history of surgical clipping or endovascular treatment, (3) who had dissecting, fusiform, traumatic or blood blister-like aneurysms or aneurysms associated with arteriovenous malformations, arteriovenous fistulas or moyamoya disease and (4) whose MRI quality was poor.
Imaging protocol
All MRI scans were performed on a 3.0-T MR scanner (Achieva TX, Philips, Best, The Netherlands) with a 32-channel head coil. First, the IA walls were imaged using a 3D black-blood T1-weighted volumetric isotropic turbo spin echo acquisition (T1-VISTA) sequence,19 which has inherent blood flow suppression before and after contrast agent administration. The imaging parameters are shown in online supplemental table 1. Postcontrast T1-VISTA was performed about 6 min after intravenous injection of gadopentetic acid (DTPA, Magnevist; Bayer Schering Pharma, Berlin, Germany; dose, 0.1 mmol/kg). All imaging parameters were kept the same for precontrast and postcontrast-enhanced T1-VISTA imaging. Furthermore, 4D-flow MRI data were acquired using a free-breathing, peripheral pulse-gated, multishot turbofield echo sequence for the evaluation of haemodynamic parameters. The scan parameters are shown in online supplemental table 1.
Supplemental material
Aneurysm enhancement analysis
The AWE pattern was defined as follows: grade 0, no enhancement; grade 1, focal enhancement; grade 2, thin (maximum thickness, ≤1 mm) circumferential AWE (CAWE) and grade 3, thick (maximum thickness, >1 mm) CAWE (figure 1).20 Focal AWE (grade 1) involved the dome, neck, intermediate portion or a bleb, whereas CAWE (grades 2 and 3) involved almost the entire aneurysm.
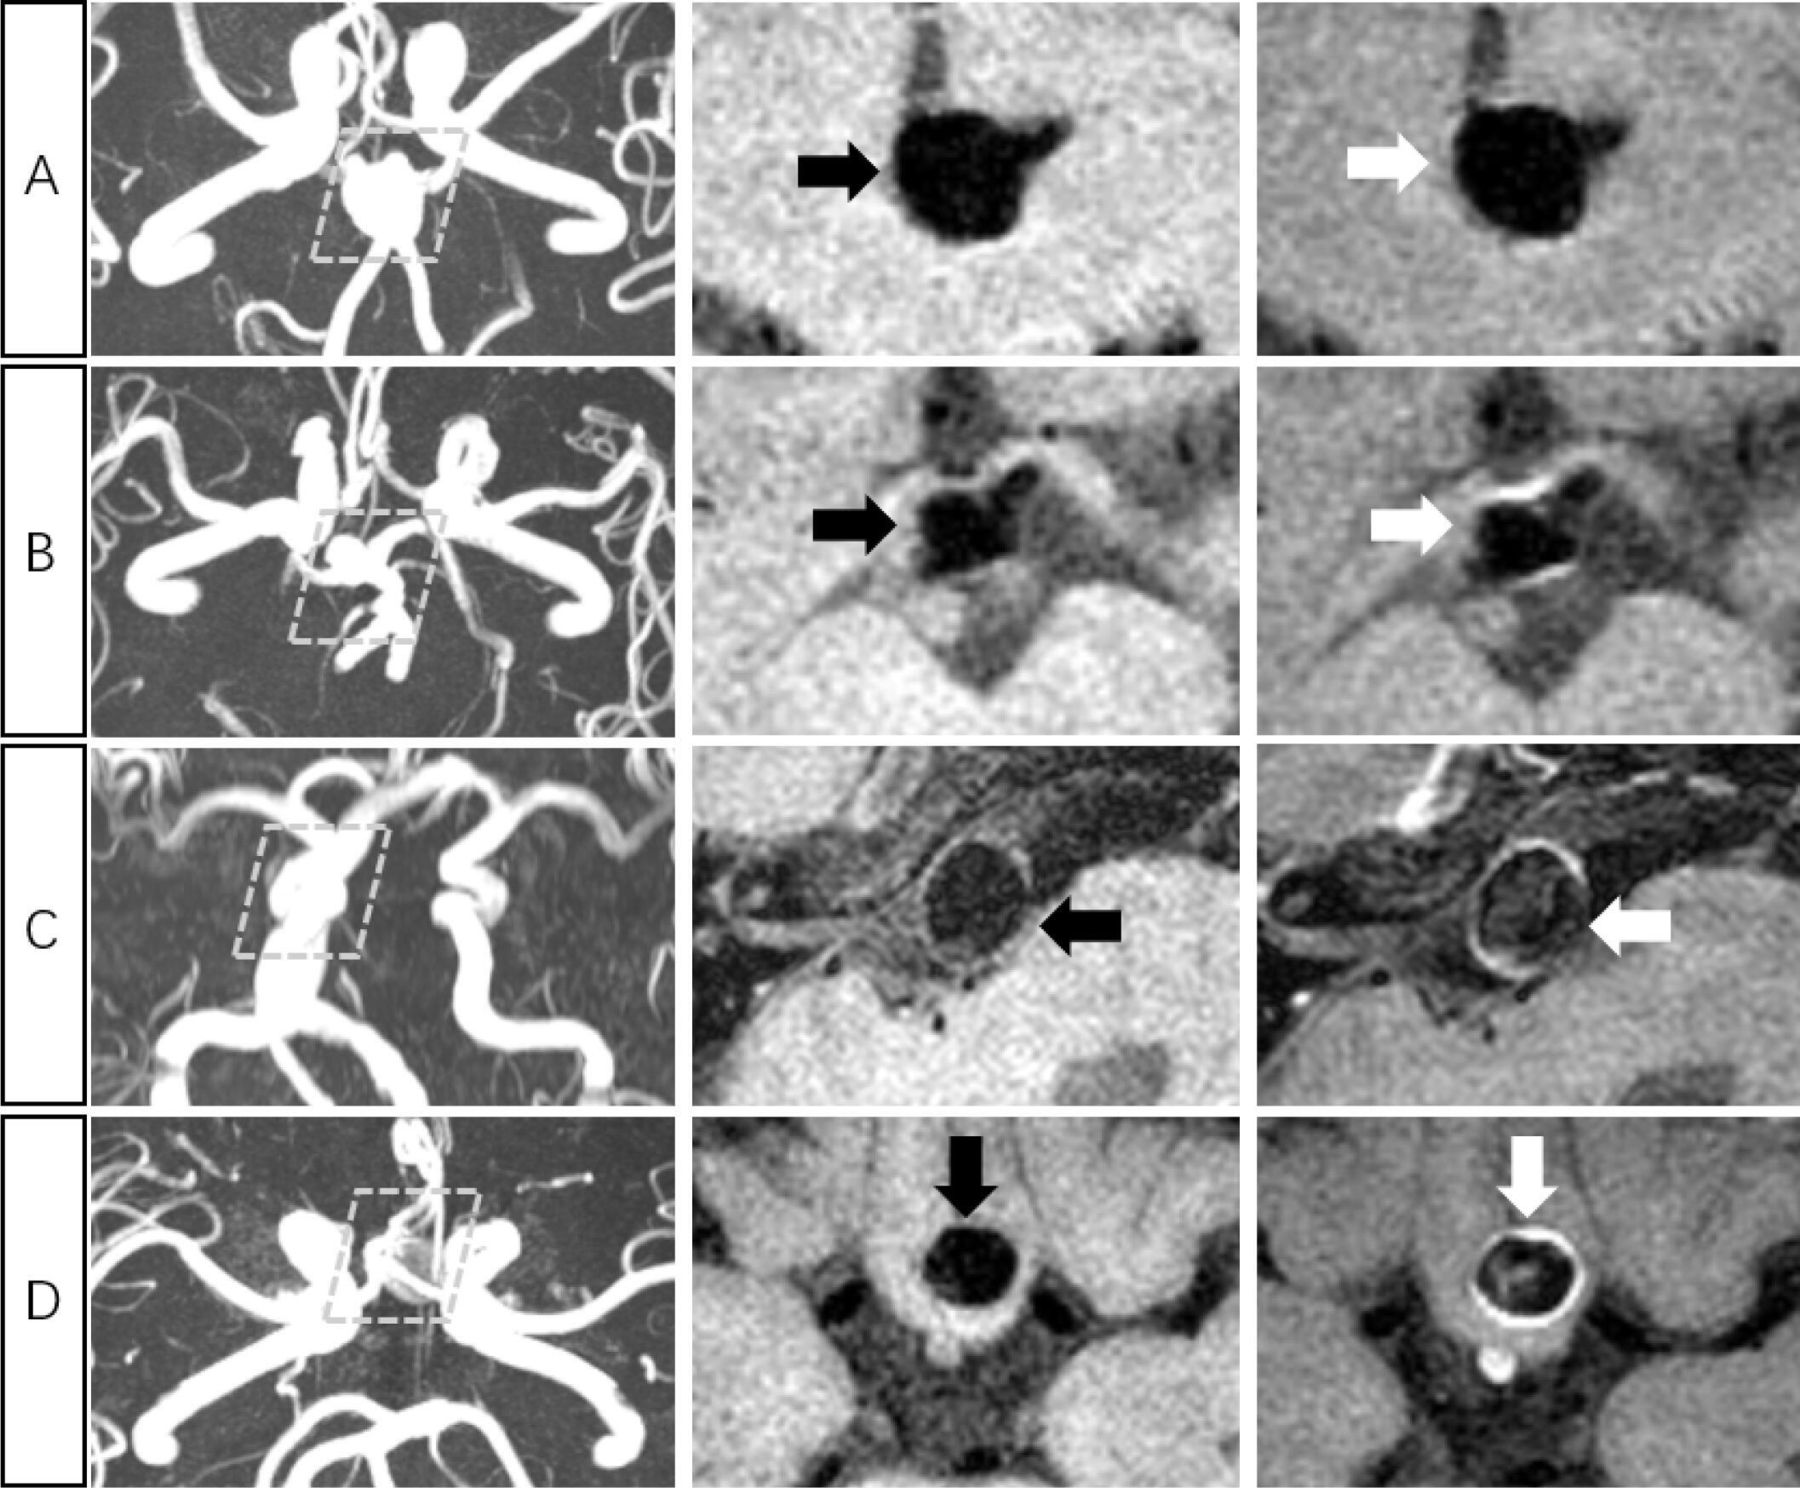
Grading of aneurysmal wall enhancement pattern 1. Each aneurysm is indicated in a row; grade 0: non-enhancing aneurysm (A); grade 1: focal-wall enhancement aneurysm (B); grade 2: thin (<1 mm) and circumferential wall enhancement aneurysm (C) and grade 3: thick (>1 mm) and circumferential wall enhancement aneurysm (D). Time-of-flight MR images (left column), pre-contrast T1-weighted volumetric isotropic turbo spin echo acquisition (T1-VISTA) images (middle column), and post-contrast T1-VISTA image (right column) are shown for each aneurysm.
The images were independently reviewed by two readers (neuroradiologists with 6 and 4 years of experience in neurovascular imaging, respectively) who were blinded to the clinical data but were aware of the aneurysm location; they determined the AWE grades using postgadolinium-contrast BB-MRI. In case of disagreement between the two readers, a consensus was reached through a joint review and discussion of the cases.
Haemodynamic analysis
All preprocessing, visualisation and quantification of 4D-flow data were performed using GTFlow, V.2.2.15 (GyroTools, Zurich, Switzerland). Preprocessing steps, including eddy current correction, velocity masks application and vessel segmentation were performed before data visualisation and quantification. Velocity-weighted masks were adopted to segment the IA, and streamlines were provided for visualisation and quantification of blood flow.
The maximum through-plane velocity (Vmax-IA, cm/s) and maximum blood flow (flowmax-IA, mL/s) were measured as haemodynamic parameters in the contour of the IA at the largest cross-sectional plane containing the maximum velocity vector. Furthermore, WSS was defined as the velocity gradient along the perpendicular direction of the IA wall.21 22 Average WSS in IA (WSSavg-IA N/m2) was calculated along the same contour. The haemodynamic parameters in the adjacent parent artery (APA) of the aneurysms, including the maximum through-plane velocity (Vmax-APA, cm/s), average blood flow (flowavg-APA, mL/s) and maximum blood flow (flowmax-APA, mL/s), were also measured at the cross-sectional plane where the maximum velocity vector appears. Flow pattern visualisation of the IAs is shown in figure 2A–D. Velocity, blood flow and WSS measurements are summarised in figure 2E.

Illustration of a set of data for four-dimensional flow data analysis and haemodynamic parameter measurements. Flow pattern visualisation of the intracranial aneurysm (IA) and adjacent parent artery (APA) were performed using (A) streamlines, maximum velocity point; the largest cross-section of the IA is shown in (B) and haemodynamic measurements within the contours were conducted in the (C) APA and (D) IA. All haemodynamic measurements were implemented in the peak systolic phase. (E) Cut planes were created in the largest cross-sectional plane of the APA and IA containing the maximum velocity vector. Maximum through-plane velocity in the APA (VAPA, cm/s), average blood flow in APA (flowavg-APA, mL/s), maximum blood flow in the APA (flowmax-APA, mL/s) were automatically measured. Furthermore, maximum through-plane velocity within the IA (VIA, cm/s), maximum blood flow in the IA (flowmax-IA, mL/s) and average wall shear stress of the IA (WSSavg, N/m2) were also automatically measured.
The inflow jet pattern and vorticity in the aneurysm were also evaluated. The inflow jet pattern was defined as concentrated (figure 3A), diffuse (figure 3B) and unvisualised18—concentrated inflow jet: a bundle of inflow streamlines intruding into the aneurysm dome with a dispersion of <20% of the width of the streamline bundle at the aneurysm orifice; diffuse inflow jet: inflow streamlines intruding into the aneurysm dome with a dispersion of >20% of the width of the streamline bundle at the aneurysm orifice and unvisualized inflow jet: no inflow streamlines into the aneurysm.18
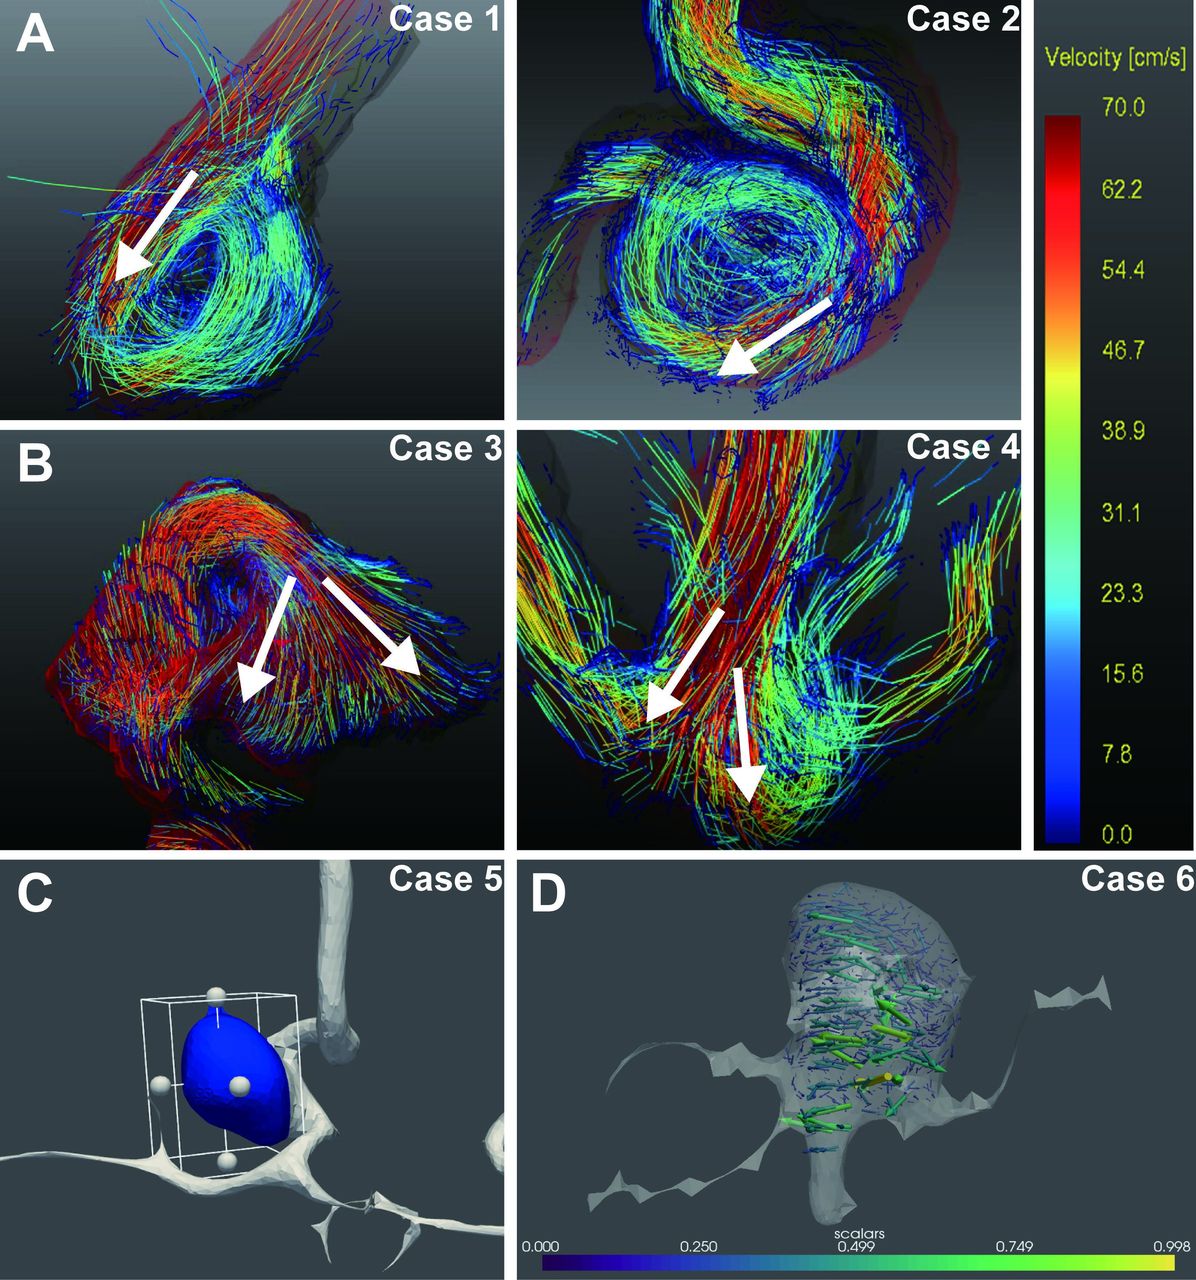
Classification of inflow jet patterns visualised on four-dimensional-flow MR images. (A) Concentrated inflow jet pattern; (B) diffuse inflow jet pattern. The calculation of vorticity; (C) the segmentation of the intracranial aneurysm and (D) the visualisation of the vorticity.
Vorticity=abs (ζx, ζy, ζz) (with ζx=δw/δy−δv/δz, ζy=δu/δz−δw/δx, ζz = δv/δx−δu/δy), where u, v and w are the vector components of the velocity in the segmented 3D space and x, y and z are the directions in the Cartesian k-space.23
The segmentation of the IA (figure 3C) and the vorticity calculations (figure 3D) were performed using a custom-built software programmed in MATLAB and Python. The maximum vorticity in the IA (vorticity max-IA, s-1) was measured as the maximum vorticity in IA. The average vorticity in the IA (vorticity avg-IA, s-1) was measured as the average vorticity in IA.
Statistical analysis
All statistical analyses were conducted with two-tailed tests using SPSS (IBM, Armonk, New York, USA). Variables are expressed as mean±SD. To investigate the correlation between the haemodynamic variables and AWE, the Spearman correlation coefficient was used. The statistical comparison was performed using Mann-Whitney U test for continuous variables and χ2 test for categorical variables. The univariate analysis was performed using a non-parametric test (Kruskal-Wallis H test for ≥3 groups). The variables for which p value was less than 0.2 were selected for the ordinal multivariate logistic regression analysis. p<0.05 was defined as indicating statistical significance. In addition, we used Cohen’s kappa to evaluate the interobserver reliability of the measurements of the discrete variables (AWE grades and inflow jet patterns). Bland-Altman plots were used to evaluate the interobserver reliability of the measurements of the continuous variables.
AWE prediction
Owing to the correlation between inflammation and haemodynamics, we designed an AWE prediction model for patients who were contraindicated for gadolinium-contrast medium injection. In the AWE prediction model, the threshold of AWE label was set between grade 0 and grades 1–3 to distinguish between non-enhanced and enhanced aneurysm walls. In the CAWE prediction model, the threshold of CAWE label was set between grades 0 and 1 and grades 2 and 3 to distinguish CAWE and other parameters; this was because recent studies have suggested that CAWE more frequently manifests in unstable rather than in stable IAs.14 15 WSS and vorticityavg-IA that were significantly associated with AWE were selected from a hypothetical analysis with features predicting AWE and CAWE. Logistic regression, a suitable model for binary classification, was chosen as the prediction model. The function glmfit, in MATLAB, was used for all logistic modelling. We performed the fivefold cross-validation 10 times repeatedly to achieve faithful prediction. During each validation, 49 cases were split almost evenly to non-overlapping fivefolds using stratification sampling with respect to the label. The model was trained using fourfolds and tested on the left fold. Sensitivity, specificity and area under the receiver operating characteristic curve (AUC) with 95% CIs was calculated to assess the performance of the model.
Results
Of 61 patients examined in the study period, 6 patients were excluded due to a history of surgical clipping or endovascular treatment; moreover, data of 7 patients with arteriovenous malformation or arteriovenous fistula-associated aneurysms were excluded. Therefore, eventually, 48 patients with 49 aneurysms were included in this study. The baseline demographic characteristics of aneurysms with different grades are summarised in table 1. Among them, 12 (24.5%) aneurysms had grade 0 AWE, 9 (18.4%) had grade 1 AWE, 15 (30.6%) had grade 2 AWE and 13 (26.5%) had grade 3 AWE.
Baseline characteristics of aneurysms with different aneurysmal wall enhancement grades
The associations between haemodynamic parameters and AWE grades are listed in table 2.
Results of Kruskal-Wallis H test and ordinal multivariate analysis to identify the aneurysmal wall enhancement patterns
As shown in table 2, in the Kruskal-Wallis H test, WSSavg-IA (p<0.001), Vmax-APA (p=0.019), inflow jet pattern (p=0.011) and vorticityavg-IA (p<0.001) were associated with AWE (p<0.05). WSSavg-IA, flowavg-APA, Vmax-APA, flowmax-APA, inflow jet pattern, vorticityavg-IA and vorticitymax-IA were associated with AWE grade (p<0.2), which were subsequently entered into the ordinal multivariate analysis. In the ordinal multivariate analysis, WSS avg-IA (p=0.002) and the vorticityavg-IA (p=0.033) showed an association (p<0.05). Among all the grades 0–3 of AWE, the concentrated inflow jet IAs tended to have a high AWE grade, whereas the diffuse inflow jet IAs tended to have a low AWE grade.
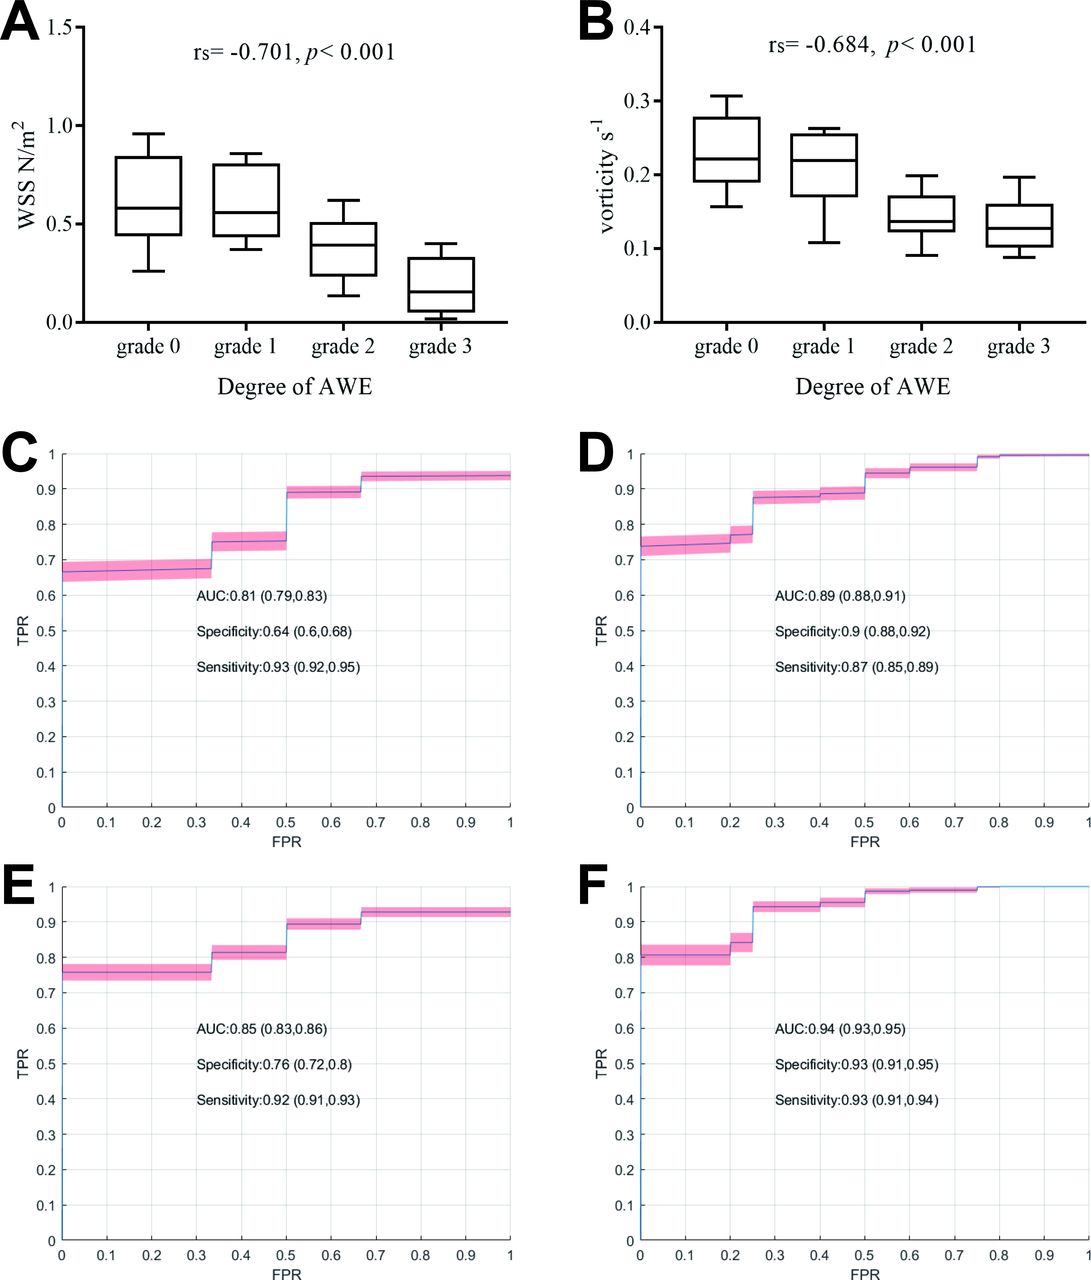
We created box diagrams illustrating the relationship between WSSavg-IA, vorticityavg-IA and the degree of AWE. The correlation coefficients (rs) were calculated using Spearman’s correlation analysis, which showed that WSSavg-IA was negatively correlated with AWE (rs=−0.701, p<0.001) (figure 4A). Figure 4B shows the relationship between vorticityavg-IA and the degree of AWE. The rs were also calculated using Spearman’s correlation analysis, which showed that vorticityavg-IA was negatively correlated with AWE (rs=−0.684, p<0.001) (figure 4B). The performance of the AWE and CAWE prediction models built using WSSavg-IA with AUCs of 0.81 and 0.89, respectively, is shown in figure 4C,D. The performance of the AWE and CAWE prediction models built using WSSavg-IA and vorticityavg-IA with AUCs of 0.85 and 0.94, respectively, is shown in figure 4E,F. Three examples of patients with and without AWE are presented in figure 5. The IA with AWE had lower WSSavg-IA than that without AWE.

Box diagram illustrating the relationship between WSS/vorticity and degree of AWE, as well as the prediction performance of AWE and CAWE. (A) Correlation coefficients were calculated using Spearman’s correlation analysis and showed that WSS is negatively correlated with AWE. (B) Correlation coefficients were calculated by Spearman’s correlation analysis and showed that the average vorticity in the IA is negatively correlated with AWE. The ROC curves of logistic regression models are (C) WSSavg-IA predict AWE, (D) WSSavg-IA predict CAWE, (E) WSSavg-IA and Vorticityavg-IA predict AWE and (F) WSSavg-IA and Vorticityavg-IA predict CAWE, respectively. AUC, sensitivity and specificity are reported with 95% CI. AUC,area under curve; AWE, aneurysmal wall enhancement; CAWE, circumferential AWE; FPR,false positive rate; IA, intracranial aneurysm; ROC, ; TPR, true positive rate; WSS, wallshear stress.

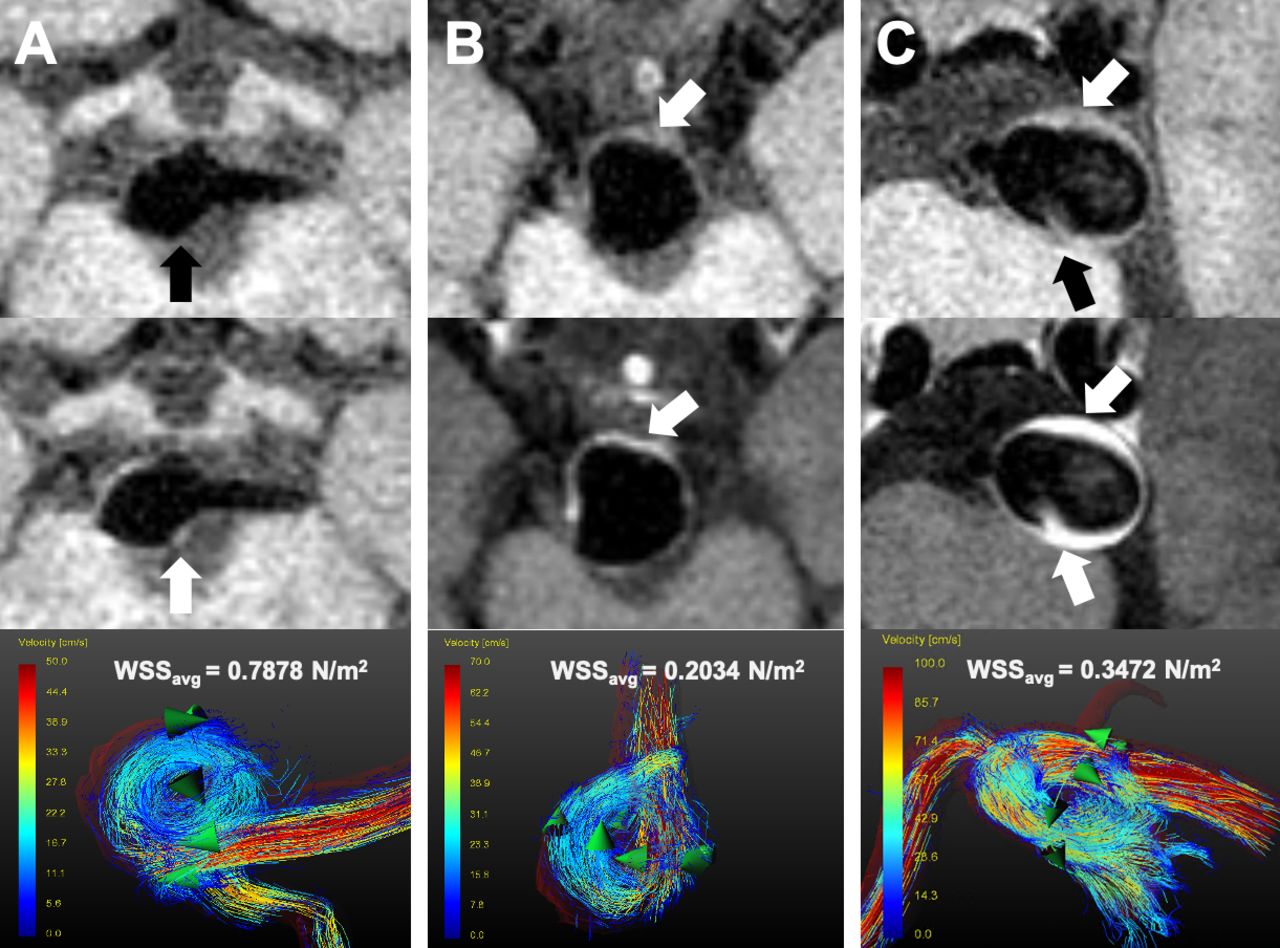
Representative example of a patient: (A) Without AWE, WSSavg-IA=0.7878 N/m2. (B and C) With AWE, WSSavg-IA=0.2034 N/m2 and 0.3472 N/m2, respectively. AWE,aneurysmal wall enhancement; IA, intracranial aneurysm; WSS, wall shear stress.
The K value of the interobserver reliability of AWE grades and inflow jet patterns were 0.779 and 0.862, respectively. The interobserver reliability of continuous variable measurement is presented in online supplemental figure 1.
Discussion
As emerging techniques, high-resolution BB-MRI and 4D-flow MRI that can visualise aneurysm wall inflammation and haemodynamic characteristics of aneurysms, respectively, could provide new insights into IA instability and rupture.18 20 24 In this study, 4D-flow MRI and high-resolution BB-MRI were used to investigate the correlations between AWE and haemodynamics in unruptured IAs. Our observations support the notion that WSS, Vmax-APA, inflow jet pattern and vorticityavg-IA are associated with AWE, and that WSS and vorticityavg-IA are independent predictors of AWE. To the best of our knowledge, no study has investigated the association between haemodynamic characteristics and AWE patterns using 4D-flow MRI and high-resolution BB-MRI, respectively.
Association between WSS and AWE
The results of our study concur with Futami et al’s18 and Khan et al’s studies,11 which demonstrated that local WSS had a significant association with AWE, as shown in figures 4A and 5A,B. These studies reported that when the aneurysm wall was exposed to low WSS, the vascular permeability may be increased, which manifested as AWE. Jing et al recently reported that low WSS values were related to atherosclerotic and hyperplastic changes in the aneurysm wall.25 In this study, we found a significant negative correlation between WSS values and AWE grades (figure 4A), which indicates that with decrease in WSS, the degree of AWE increases (figure 4A). Thus, such aneurysms are more likely to rupture because those with high-grade AWE have a higher rupture risk.20 Figure 5C shows a patient who presented with basilar aneurysm; 4D-flow MRI revealed that the patient had a slow flow in the IA, which may suggest a low rupture risk. However, the aneurysm ruptured after 1 month of conservative treatment. High-resolution BB-MRI showed that the patient’s aneurysm had the highest level of CAWE. Low WSS may promote the process of inflammation.
In the AWE and CAWE prediction model (figure 4C,D), WSSavg-IA was identified as an excellent predictor. This observation is consistent with the result of Spearman correlation analysis conducted in this study. AWE grades and WSS provide information that complements conventional aneurysm rupture criteria, which may inform healthcare practitioners of the future risk of aneurysm ruptures.
Association between inflow jet pattern and AWE
Previous studies have revealed that inflow jet patterns may help stratify the risk of aneurysm rupture.18 Futami et al had reported four classifications (concentrated, diffuse, neck-limited and unvisualised) of the inflow jet pattern in IAs using 4D-flow MRI.18 In our study, because the small number of patients in the neck-limited and unvisualised groups, we merged the two into the ‘unvisualised group’. Although the inflow jet pattern was not identified as an independent risk factor for AWE, we found that the concentrated inflow jet (p=0.008) and diffuse inflow jet (p<0.001) were associated with AWE grade. Among all the grades 0–3 of AWE (table 1), concentrated inflow jets accounted a greater proportion of high-level AWE, whereas diffuse inflow jets accounted for a greater proportion of low-level AWE. All these findings indicate that the concentrated inflow jet is mainly associated with high AWE grades, whereas the diffuse inflow jet may be mainly associated with low AWE grades.
The inflow jet impacting on the aneurysm wall may damage the endothelial layer and result in an inflammatory response.10 Concentrated inflow jets with a high velocity and volume may exert a stronger impact on the small area of the aneurysm wall than those with a low velocity and volume. Thus, concentrated inflow jets cause more inflammation than the diffuse inflow jet.10 Therefore, the IPs were initially stronger locally and may have spread into the entire aneurysm wall shortly thereafter, presenting as high AWE grades, which are associated with a high aneurysm rupture risk. As the diffuse inflow jet has a disperse flow, its impact on the aneurysm wall may be weaker than that of the concentrated inflow jet. Moreover, as the WSS is the tangential force originating from the horizontal blood flow on the aneurysm wall surface, the concentrated inflow jet may tend to have lower WSS, which is associated with a higher AWE grade, and both of which are related to aneurysm rupture. As shown in our study, the mean value of WSS in the concentrated inflow group was 0.353, while it was 0.503 (p=0.045) in the diffuse group. Cebral et al previously reported that the concentrated inflow jet pattern is more frequently seen in ruptured aneurysms, whereas diffuse inflow jet patterns tended to appear in unruptured aneurysms.26 27 Regarding the other two inflow jet patterns, the results were non-significant, which may be due to the small sample size. In the future, further studies are needed to clarify what the nature and degree of inflow jet patterns that are more likely to cause aneurysm ruptures.18
Association between vorticity and AWE
The complexity and instability of the vorticity in aneurysms have long been considered as risk factors for aneurysm rupture. Recently, Futami et al reported that identifying the vortex cores might help clarify aneurysm rupture risk.24 Schnell et al 23 reported that the vorticity is low in growing aneurysms than in stable aneurysms. However, the detailed correlations between vorticity and aneurysm wall remain unclear. In the current study, the average vorticity in IA was identified as an independent predictor of AWE. Vorticityavg-IA was negatively correlated with AWE (rs=−0.684, p<0.001) (figure 4B). In the AWE and CAWE prediction model (figure 4E,F), when we added the vorticityavg-IA parameters, the prediction model got better (improvement of 4% and 5%, respectively). This result indicated that including vortex parameters is helpful for AWE prediction. However, in reality, blood flow near the aneurysm wall, under complex physiological conditions, may recirculate, slow down and vibrate,28 which creates low vorticity areas; this consequently promotes atherogenesis and increases the infiltration of inflammatory cells in the aneurysm wall,25 which may manifest as CAWE with a high rupture risk.
In this study, we found that velocity and volume in the parent artery or in the aneurysm were not significantly associated with the AWE grade. Jing et al 25 reported that slow flow was associated with atherosclerotic changes in the aneurysm wall; this could have been due to a small sample size.
Strengths and Limitations
The current study is the first to investigate the associations between haemodynamics and AWE by combining 4D-flow MRI and high-resolution BB-MRI. Moreover, we have included new parameters for AWE prediction, such as inflow patterns and AWE grades.
Despite the strengths, this study has some limitations. The first limitation is that patients with unruptured saccular IA <4 mm were not recruited because of its low resolution of 4D-flow MRI. This may cause bias when extrapolating the study conclusion to the cases that did not conform to the inclusion criteria. Second, the limited resolution of 4D-flow MRI might underestimate the magnitude of WSS.22 23 Third, the segmentation of the aneurysms was performed manually; thus, automatic analysis algorithms need to be developed. In addition, the present findings need histological data to demonstrate the associations between haemodynamics and aneurysm wall properties directly.
Conclusions
Low WSS and low average vorticity were independently associated with a high AWE grade for IAs larger than 4 mm. WSS and average vorticity could predict AWE and CAWE.
Data availability statement
Data are available upon reasonable request. Anonymized data will be shared by request from any qualified investigator.
Ethics statements
Patient consent for publication
Ethics approval
In this study, all protocols were approved by the Institutional Review Board of Beijing Tiantan Hospital and conducted in accordance with the 1964 Helsinki Declaration and its later amendments or comparable ethical standards.
Acknowledgments
We would like to thank Yuesong Pan from the China National Clinical Research Center for Neurological Diseases, for their help in analysis and interpretation of data. We thank Qinchu Jin for the idea of AWE prediction. We also thank Baorui Zhang for data collection.
References
Supplementary material
Supplementary Data
This web only file has been produced by the BMJ Publishing Group from an electronic file supplied by the author(s) and has not been edited for content.
Footnotes
MZ, FP and XT contributed equally.
AL and RL contributed equally.
Contributors Study concept and design: AL and RL; data acquisition: XF, YL, HN, BZ, GS and PL; data analysis and drafting the manuscript: MZ, FP and XT; data verification: HC and YL; agreement to be accountable for all aspects of the work: RL.
Funding This work was supported by the Natural Science Foundation of China (number 81971604), the Natural Science Foundation of China (number 81771233), the Natural Science Foundation of Beijing (number L192013), the Natural Science Foundation of China (number 81901197), Specific Research Projects for Capital Health Development (2018-2-2041), Beijing Science and Technology Planning Project: Beijing‐Tianjin‐Hebei Collaborative Innovation Promotion Project (Z181100009618035).
Competing interests None declared.
Provenance and peer review Not commissioned; externally peer reviewed.