Article Text

Abstract
China faces the greatest challenge from stroke in the world. The death rate for cerebrovascular diseases in China was 149.49 per 100 000, accounting for 1.57 million deaths in 2018. It ranked third among the leading causes of death behind malignant tumours and heart disease. The age-standardised prevalence and incidence of stroke in 2013 were 1114.8 per 100 000 population and 246.8 per 100 000 person-years, respectively. According to the Global Burden of Disease Study 2017, the years of life lost (YLLs) per 100 000 population for stroke increased by 14.6%; YLLs due to stroke rose from third highest among all causes in 1990 to the highest in 2017. The absolute numbers and rates per 100 000 population for all-age disability-adjusted life years (DALYs) for stroke increased substantially between 1990 and 2017, and stroke was the leading cause of all-age DALYs in 2017. The main contributors to cerebrovascular diseases include behavioural risk factors (smoking and alcohol use) and pre-existing conditions (hypertension, diabetes mellitus, dyslipidaemia and atrial fibrillation (AF)). The most prevalent risk factors among stroke survivors were hypertension (63.0%-84.2%) and smoking (31.7%-47.6%). The least prevalent was AF (2.7%-7.4%). The prevalences for major risk factors for stroke are high and most have increased over time. Based on the latest national epidemiological data, 26.6% of adults aged ≥15 years (307.6 million adults) smoked tobacco products. For those aged ≥18 years, age-adjusted prevalence of hypertension was 25.2%; adjusted prevalence of hypercholesterolaemia was 5.8%; and the standardised prevalence of diabetes was 10.9%. For those aged ≥40 years, the standardised prevalence of AF was 2.31%. Data from the Hospital Quality Monitoring System showed that 3 010 204 inpatients with stroke were admitted to 1853 tertiary care hospitals during 2018. Of those, 2 466 785 (81.9%) were ischaemic strokes (ISs); 447 609 (14.9%) were intracerebral haemorrhages (ICHs); and 95 810 (3.2%) were subarachnoid haemorrhages (SAHs). The average age of patients admitted was 66 years old, and nearly 60% were male. A total of 1555 (0.1%), 2774 (0.6%) and 1347 (1.4%) paediatric strokes (age <18 years) were identified among IS, ICH and SAH, respectively. Over one-third (1 063 892 (35.3%)) of the patients were covered by urban resident basic medical insurance, followed by urban employee basic medical insurance (699 513 (23.2%)) and new rural cooperative medical schema (489 361 (16.3%)). The leading risk factor was hypertension (67.4% for IS, 77.2% for ICH and 49.1% for SAH), and the leading comorbidity was pneumonia or pulmonary infection (10.1% for IS, 31.4% for ICH and 25.2% for SAH). In-hospital death/discharge against medical advice rate was 8.3% for stroke inpatients, ranging from 5.8% for IS to 19.5% for ICH. The median and IQR of length of stay was 10.0 (7.0–14.0) days, ranging from 10.0 (7.0–13.0) in IS to 14.0 (8.0–22.0) in SAH. Data from the Chinese Stroke Center Alliance demonstrated that the composite scores of guideline-recommended key performance indicators for patients with IS, ICH and SAH were 0.77±0.21, 0.72±0.28 and 0.59±0.32, respectively.
- stroke
- statistics
This is an open access article distributed in accordance with the Creative Commons Attribution Non Commercial (CC BY-NC 4.0) license, which permits others to distribute, remix, adapt, build upon this work non-commercially, and license their derivative works on different terms, provided the original work is properly cited, appropriate credit is given, any changes made indicated, and the use is non-commercial. See: http://creativecommons.org/licenses/by-nc/4.0/.
Statistics from Altmetric.com
Introduction
Stroke was the third highest cause of death in China, accounting for 1.57 million deaths in 2018.1 The 2016 Global Burden of Disease (GBD) study estimated that China had the highest estimated lifetime risk of stroke from age 25 years onward of up to 39.3%.2 Stroke has imposed an enormous disease burden on the healthcare system in China. Tracking risk factors, clinical characteristics, management patterns and outcomes of patients with stroke will facilitate resource allocation and priority setting in healthcare system. The prevalences for major risk factors for stroke are high in the general population and among stroke survivors, and most have increased over time. National surveillance systems, such as mortality surveillance, nutrition and chronic disease surveillance, and tobacco surveillance can regularly assess changes in risk factors in the general population. In the past decades, several registry studies have been launched, including the China National Stroke Registries (CNSR-I, CNSR-II and CNSR-III).3–5 These registries provide timely evidence for clinical practice and scientific research.
In this report, we aim to use contemporary nationally representative data from surveillance systems, epidemiological surveys, administrative databases, registry databases and research projects6 to assess the prevalence and trends in community-based risk factors, clinical characteristics, management and outcomes of patients hospitalised in China. In addition, up-to-date evidence for healthcare resource allocation, planning and optimisation is provided.
Methods
This is a post hoc analysis based on information from multiple sources. We abstracted the most up-to-date data available to support the analyses in this report. Findings of stroke-related risk factors were extracted from published literature and surveillance reports. Patient demographic characteristics, comorbidities, procedures/operations and in-hospital outcomes were abstracted from the Hospital Quality Monitoring System (HQMS); in-hospital key performance indicators were abstracted from the Chinese Stroke Center Alliance (CSCA). The contents of this report have been internally and externally reviewed and approved by the National Center for Healthcare Quality Management in Neurological Diseases.
Data sources
The National Mortality Surveillance System (NMSS) provides the total and cause-specific mortality by provinces and facilitates the development of a comprehensive real-time registration and mortality surveillance system. This system covered 24% of the Chinese population and has 605 points of surveillance. To ensure representation at the provincial level, these 605 surveillance points were selected to cover China’s 31 provinces using a multistage stratification method that accounted for sociodemographic characteristics of each region.1 ‘Province’ is hereafter referred to in this report to encompass provinces, autonomous regions and municipalities in China.
The National Epidemiological Survey of Stroke in China (NESS-China) was conducted in 157 survey sites (64 urban and 93 rural sites) in China. A multistage stratified cluster-sampling method was applied. The study was designed as a door-to-door survey, and participants were people who had lived in that county or district for at least 6 months. The point-prevalence day was determined as 31 August 2013. The population-based incidence rates of stroke were estimated between 1 September 2012 and 31 August 2013. A total of 480 687 participants completed the survey, with an overall response rate of 81%.7
The China National Stroke Registry (CNSR) was a nationwide prospective registry for patients presented to hospitals with acute cerebrovascular events. CNSR-I was conducted between September 2007 and August 2008. A total of 132 study sites were selected, including 100 tertiary and 32 secondary urban hospitals in 27 provinces and four municipalities in Mainland China. A total of 21 902 patients aged ≥18 years were eligible and had complete information at baseline. Among the patients, 66.4% had IS.5
CNSR-II was launched during June 2012 to January 2013 and enrolled 219 hospitals. Among them, 72 hospitals participated in both CNSR-I and II, 59 sites only in CNSR-I and 147 hospitals only in CNSR-II. CNSR-II recruited 19 604 inpatients ≥18 years of age with acute IS.4
Between August 2015 and March 2018, CNSR-III recruited consecutive patients with IS or transient ischaemic attack from 201 hospitals that cover 22 provinces and four municipalities in China. A total of 15 166 patients with stroke were enrolled, among whom 93.3% had IS.3
The Global Adult Tobacco Survey (GATS) used a global standardised methodology. In China, GATS was conducted in 2018 as a household survey of persons ≥15 years of age by the Chinese Center for Disease Control and Prevention (China CDC). A total of 24 370 households were sampled and one individual was randomly selected from each participating household to complete the survey. Survey information was collected electronically by using handheld devices. A total of 19 376 individuals completed the interview with an overall response rate of 91.5%.8
The Chinese Nutrition and Health Surveillance (CNHS) was a nationally representative cross-sectional study conducted by the China CDC to assess population health and nutrition status every 10 years. A stratified multistage cluster sampling was used. CNHS 2002 covered 132 surveillance sites consisting of 71 280 households and 252 912 subjects in 31 provinces.9
The first part of CNHS 2010–2013 was conducted during 2010 and 2012, randomly selecting 150 districts or counties within the 31 provinces and covering a total of 66 438 households. The second part of CNHS 2010–2013 was completed in children aged <6 years and lactating mothers in 55 surveillance sites. The final study sampled 36 878 children aged 0–5 years, 44 306 toddlers and adolescents aged 6–17 years, 157 850 non-pregnant adults ≥18 years of age and 4315 pregnant women.10
The Chinese Adults Nutrition and Chronic Diseases Surveillance (CANCDS) 2015 was a nationally and provincially representative surveillance study conducted by the China CDC. Multistage stratified cluster random sampling was used and based on the NMSS. CANCDS 2015 covered 302 surveillance sites in 31 provinces, and 179 728 participants provided data for the analysis of blood lipid levels.11
The China Patient-Centered Evaluative Assessment of Cardiac Events (PEACE) Million Persons Project was a population-based screening project conducted from 15 September 2014 to 20 June 2017. A convenience sampling strategy was used to select 141 sites (88 rural counties and 53 urban districts) from 31 provinces in Mainland China. Residents who were 35–75 years old and had lived in the selected regions for at least 6 of the previous 12 months were enrolled. The sample contained 1 738 886 participants with a mean age of 55.6 years and a majority (59.5%) were female.12
The China Chronic Disease and Risk Factors Surveillance (CDRFS) study is a nationwide cross-sectional study conducted every 3 years. The study was designed to measure the epidemiology of chronic disease and associated risk factors by selecting a nationally representative sample of the general population. In the 2010 survey, a total of 298 surveillance points were used in the 31 provinces. A total of 97 200 participants aged ≥18 years were enrolled in the survey. In the 2013 survey, a total of 179 347 participants were enrolled in the survey. The overall response rate was 93.4%.13
The China National Stroke Screening and Prevention Project (CNSSPP) is an ongoing community-based study that was conducted by the National Project Office of Stroke Prevention and Control. The CNSSPP used a two-stage stratified cluster sampling method. The cluster sampling method was used in every primary sampling unit, and all residents aged ≥40 years were surveyed during the primary screening. A total of 726 451 residents (386 975 women and 339 476 men) were included from October 2014 to November 2015.14
Data sources for epidemiology and risk factors of stroke are summarised in table 1.
Epidemiology of stroke and related risk factors and their data sources
The Hospital Quality Monitoring System (HQMS) database is a mandatory national inpatient database system under the authority of the National Health Commission of the People’s Republic of China. All tertiary care hospitals in China were required to submit standardised inpatient discharge records to HQMS. Patient data were collected from the nationally standardised front page of the hospital medical record. A total of 642 variables, including demographics of in-hospital patients, clinical diagnostic codes from the International Classification of Diseases (ICD), procedures and operations, costs, and information about affiliated hospitals or divisions were collected. The HQMS data reporting system performs automated data quality control on a daily basis at the time of data submission to ensure the completeness, consistency, and accuracy of data. If inconsistencies are detected, the entire daily data package of the hospital will be rejected and the hospital will be required to review and resubmit.15
The Chinese Stroke Center Alliance (CSCA) database is a national, hospital-based, voluntary, multifaceted intervention and continuous quality improvement initiative that provides a unique platform to develop stroke centres, improve stroke care quality and clinical outcomes. The CSCA was designed and led by a team of volunteers from the China Stroke Association under the guidance of the National Center for Healthcare Quality Management in Neurological Diseases.6 Data were collected via the web-based patient data collection and management tool (Medicine Innovation Research Centre, Beijing, China), abstracted via chart review, coded, deidentified and transmitted in a secure manner in order to maintain patient confidentiality and to remain compliant with national privacy standards. The following data were collected for each hospitalisation: patient demographics, history of diseases and medications taken, hospital presentation, initial neurological status, medications and interventions during the hospital stay, reperfusion strategy, in-hospital outcomes and complications.6
Identification of diagnosis for stroke, comorbidities and procedures
Stroke diagnosis and comorbidities in HQMS were identified by main diagnosis using National Clinical V.2.0 of the International Classification of Diseases, 10th Revision, disease codes. Stroke diagnosis in CSCA was determined at discharge. Procedures or interventions were identified by International Classification of Diseases, Ninth Revision, Clinical Modification, Volume 3 (table 2).
ICD-10 disease code used for identification of patients with stroke and comorbidities and ICD-9-CM code used for identification of interventions or procedures
Key performance indicators
A total of 11 guideline-recommended performance metrics of medication usage were prespecified for this study based on the national guidelines and the Get With The Guidelines-Stroke criteria. Detailed definitions are listed in table 3.
Specifications of guideline-recommended performance measures
Statistical methods
Data were presented as means with SD or medians with IQRs for continuous variables and as frequencies with percentages for categorical variables. We did not report p values because large sample sizes in HQMS and CSCA would likely yield statistically significant p values with small absolute differences that may not be clinically meaningful. All statistical analyses were performed using SAS V.9.4. To enhance the speed and efficiency of report creation and presentation, a SAS macro called %ggBaseline was used to analyse and report results automatically.16
Results
Stroke (cerebrovascular disease)
Mortality rate
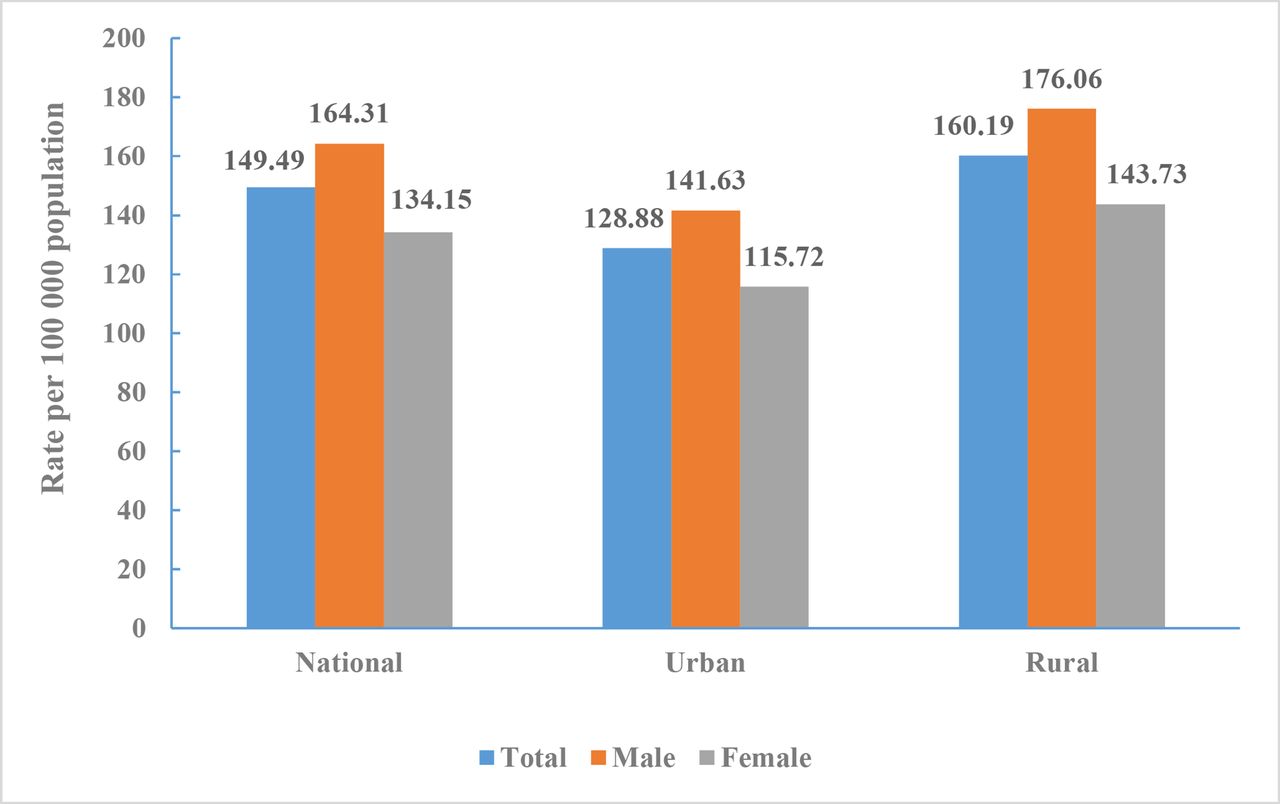
The death rate of cerebrovascular disease in China was 149.49 per 100 000 (1.57 million total) in 2018, accounting for 22.33% of all deaths. It ranked third among all causes of death behind malignant tumours (160.17 per 100 000) and heart disease (156.73 per 100 000).
The death rate of cerebrovascular disease in men was 164.31 per 100 000, ranking second behind malignant tumours (203.59 per 100 000). The death rate in women was 134.15 per 100 000, ranking second behind heart disease (152.74 per 100 000).
The death rate of cerebrovascular disease in urban and rural residents were 128.88 per 100 000 and 160.19 per 100 000, respectively, ranking third in cities and second in rural areas (figure 1).

Crude mortality rate of cerebrovascular disease in Chinese residents by sex and region, National Mortality Surveillance System 2018.
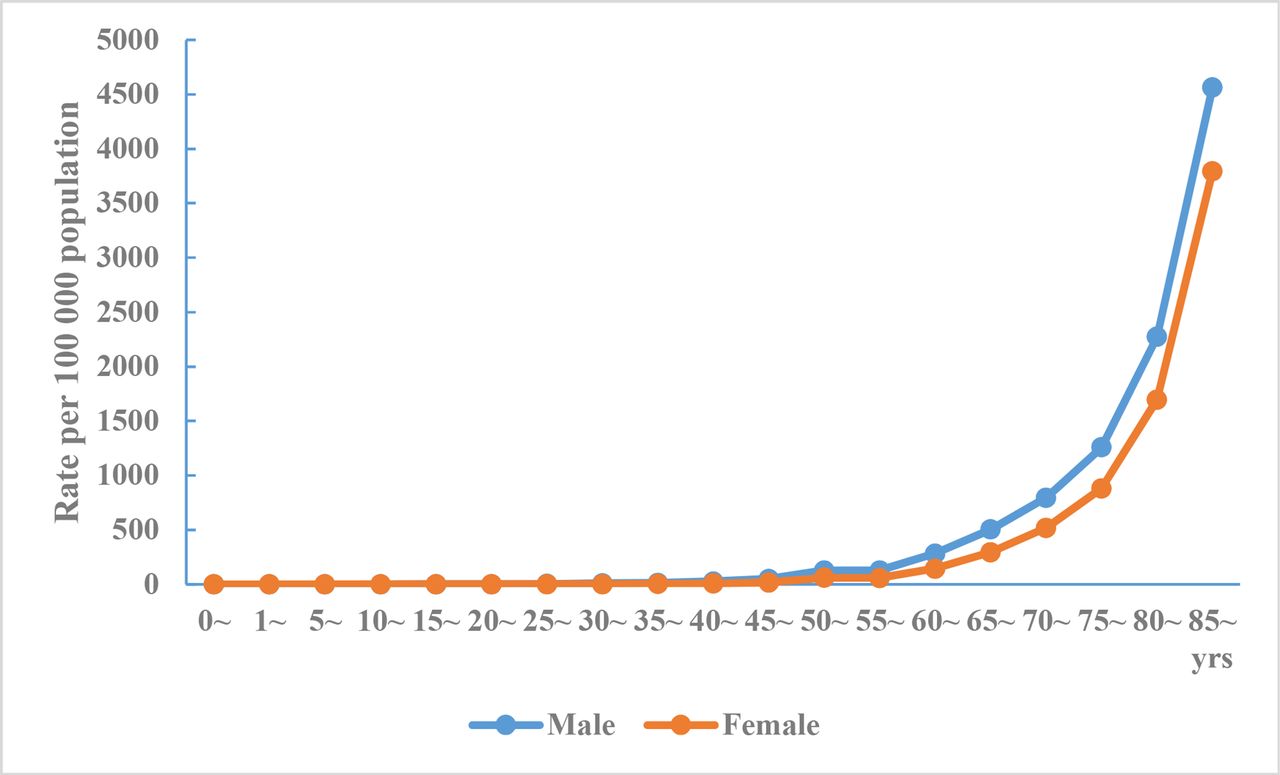
The death rate of cerebrovascular disease in urban and rural areas increases with age, and the death rate in men was higher than that in women for all age groups (figures 2 and 3).
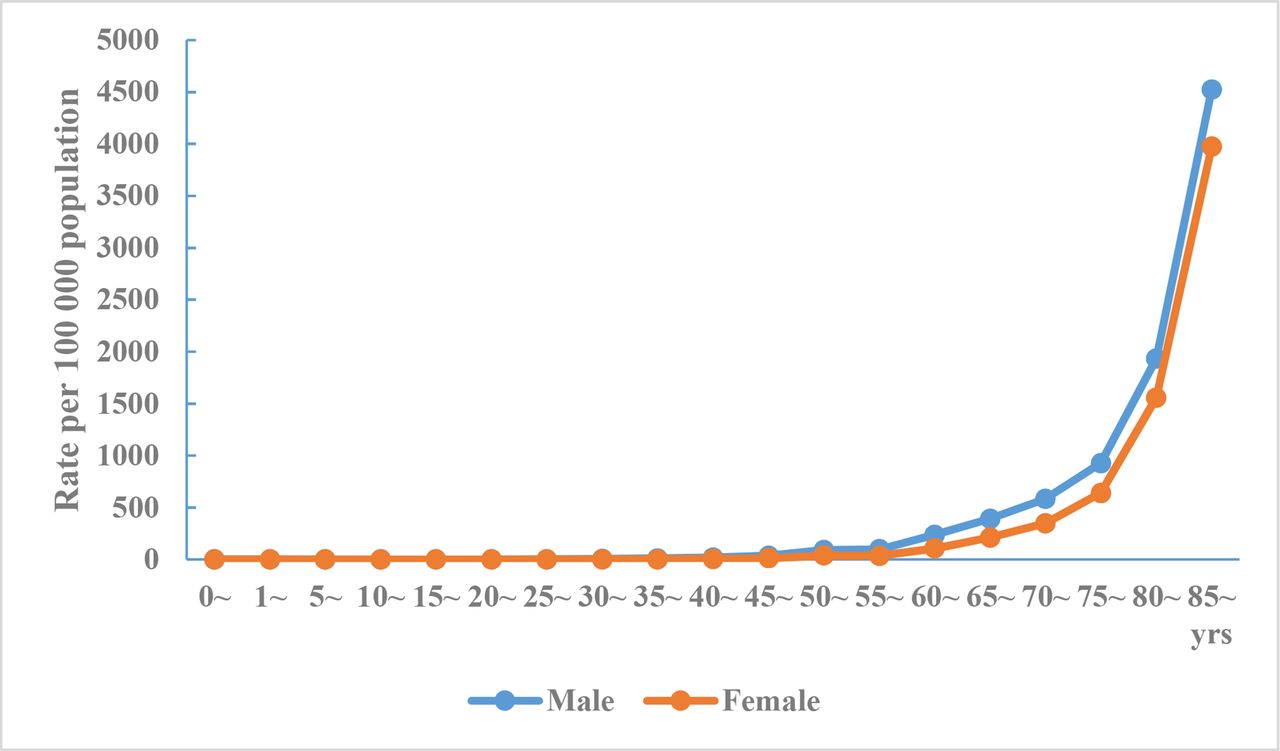
Crude mortality rate of cerebrovascular disease in Chinese urban residents by age and sex, National Mortality Surveillance System 2018.

Crude mortality rate of cerebrovascular disease in Chinese rural residents by age and sex, National Mortality Surveillance System 2018.
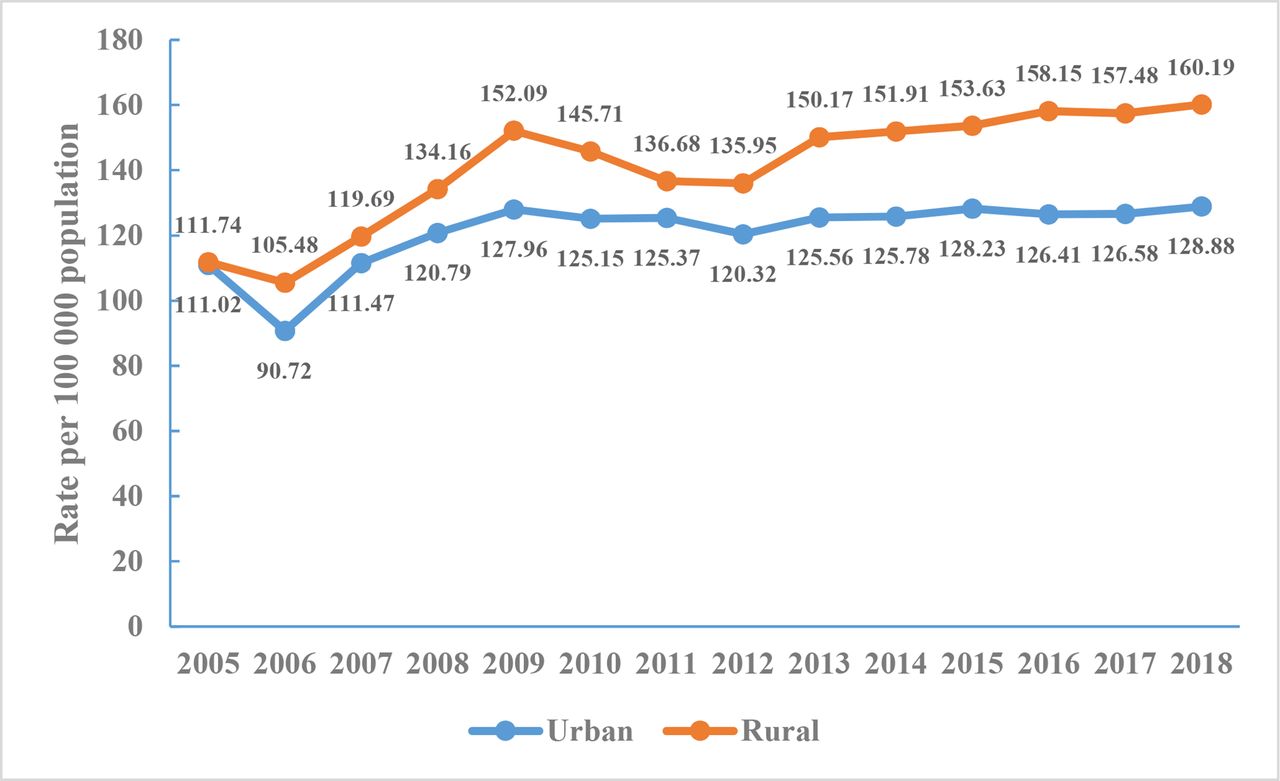
The annual crude mortality of cerebrovascular disease in rural areas was higher than that in urban areas from 2005 to 2018. Cerebrovascular disease mortality increased by 1.41 times in cities and 1.44 times in rural areas from 2006 to 2009. The crude death rate of cerebrovascular disease in 2009–2012 showed a downward trend but increased slightly during 2013–2018, and this change was observed to be more pronounced in rural areas (figure 4).

Crude mortality rate of cerebrovascular disease in Chinese residents, National Mortality Surveillance System 2005–2018.
Prevalence and incidence
According the data from NESS-China 2013, 7672 out of 480 687 participants were diagnosed with a prevalent stroke. The mean age of participants with prevalent strokes was 66.4 years (66.2 years for men and 66.6 years for women). The crude prevalence of stroke was 1596.0/100 000. The age-standardised prevalence of stroke was 1114.8/100 000. The crude and age-standardised prevalence of stroke were 1768.7 /100 000 and 1222.2/100 000 for men, and 1426.2/100 000 and 1005.7/100 000 for women. The age-standardised prevalence of stroke did not differ significantly between men and women. The age-specific prevalence of stroke was markedly higher among men than among women across all age groups except for those aged 20–39 years. The age-specific prevalence of stroke increased with older age in both men and women, with a particularly marked increase in those aged ≥50 years (figure 5).

Age-specific prevalence of stroke per 100 000 of Chinese adults by sex, National Epidemiological Survey of Stroke in China 2013.
There were 1643 incident stroke cases (55.0% were men) identified between 1 September 2012 and 31 August 2013. The mean age of people with incident stroke was 66.4 years: 65.5 years in men and 67.6 years in women. The crude incidence of stroke was 345.1 per 100 000 person-years. The age-standardised incidence of stroke was 246.8 per 100 000 person-years. The crude and age-standardised incidence of stroke were 382.2 and 266.4 per 100 000 person-years for men, 308.5 and 226.9 per 100 000 person-years for women. There were no statistically significant sex differences in the age-standardised incidence rates. Stroke incidence in rural residents (298.2/100 000) was significantly greater than that in urban residents (203.6/100 000) (figure 6).

Incidence rates of stroke per 100 000 person-years of Chinese adults (≥20 years) by sex, National Epidemiological Survey of Stroke in China 2013.
Disease burden
According to the data from NESS-China 2013, the years of life lost (YLLs) for stroke was 1748 per 100 000 people; the years lived with disability (YLDs) was 262 per 100 000 people; and disability-adjusted life years (DALYs) was 2010 per 100 000 people. DALYs were 2171 per 100 000 for men and 1848 per 100 000 for women. The YLLs, YLDs and DALYs in rural areas were 1964/100 000, 294/100 000 and 2258/100 000, respectively. YLLs, YLDs and DALYs in urban areas were 1533/100 000, 229/100 000 and 1762/100 000, respectively.17
According to results from the GBD study 2017, YLLs per 100 000 population for stroke increased from 2298 in 1990 to 2633 in 2017, an increase of 14.6%. The age-standardised YLLs decreased by 38.8%, while YLLs due to stroke rose from the third highest among all causes in 1990 to the highest in 2017. The absolute numbers and rates per 100 000 population for all-age DALYs for stroke increased substantially between 1990 and 2017 (DALY counts increased by 46.8%, while the DALY rate increased by 24.4%), but age-standardised DALYs per 100 000 population decreased by 33.1% during this period. Stroke was the leading cause of all-age DALYs in 2017, replacing lower respiratory infections and neonatal disorders, which was the leading cause of all-age DALYs in 1990.18
Risk factors in stroke survivors
According to data from NESS-China 2013, the most prevalent risk factors in stroke survivors were hypertension (84.2%), smoking (47.6%) and alcohol use (43.9%). The least prevalent was AF (2.7%). The prevalence of diabetes mellitus, dyslipidaemia, AF and coronary heart disease (CHD) was significantly greater in women, but the prevalence of alcohol use and smoking was significantly greater in men. Although there was no significant difference in the prevalence of hypertension, alcohol use and smoking between urban and rural participants, diabetes mellitus, dyslipidaemia, AF and CHD were more prevalent among urban participants (table 4).
Prevalence of some risk factors in stroke survivors by sex and residency, National Epidemiological Survey of Stroke in China 2013
We further analysed the prevalent risk factors in patients with IS by using data from CNSR. The final sample sizes of patients with IS were 12 173 in CNSR-I, 19 604 in CNSR-II and 13 982 in CNSR-III. Hypertension and current smoking were the risk factors with the high prevalences, and the prevalence of AF was the lowest (table 5).
Prevalence of risk factors in patients with ischaemic stroke, CNSRs I–III
Risk factors in general population
Health behaviours
Smoking/tobacco use
According to the China GATS 2018 data, among adults ≥15 years of age, 26.6% overall (307.6 million adults), 50.5% of men and 2.1% of women were current smokers. About 23.2% overall (268.9 million adults), 44.4% of men and 1.6% of women smoked tobacco on a daily basis.
Over half of the adults (216.9 million, 50.9%) who worked indoors were exposed to tobacco smoke at their workplace, and 44.9% (515.0 million) were exposed to tobacco smoke at home (table 6 and figure 7).
Prevalence of tobacco use for adults ≥15 years of age by sex, China Global Adult Tobacco Survey 2018
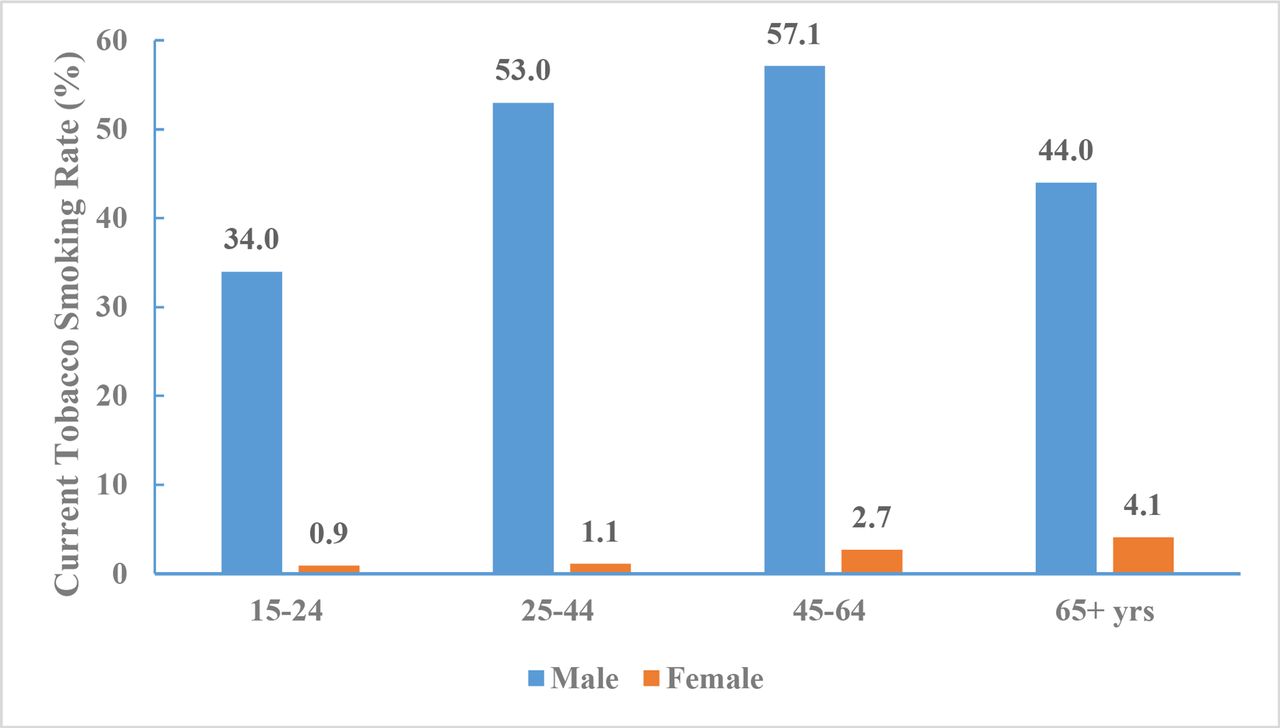
Current tobacco smoking rate for adults aged 15 years and older by age and sex, China Global Adult Tobacco Survey 2018.
Food and nutrition
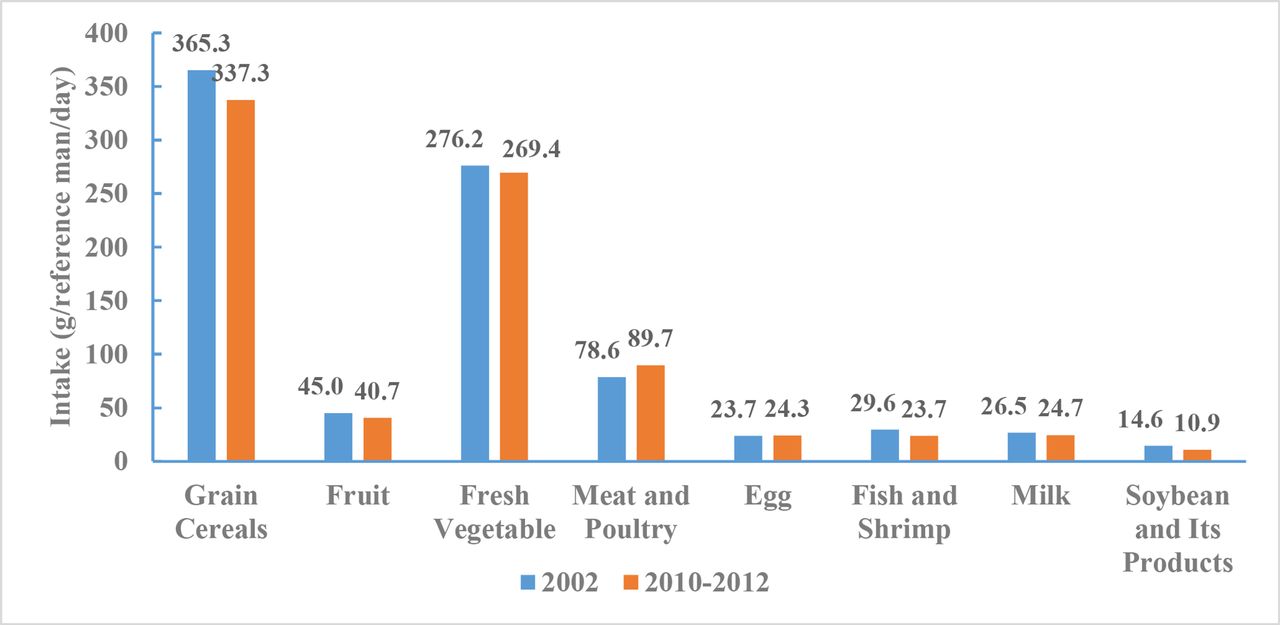
The average daily food consumption by Chinese adults, categorised by selected nutrients related to cardiometabolic health, was based on the data from CNHS 2002 and 2010–2012.
From 2010 to 2012, consumption of grain cereals per capita per day was 337.3 g, consisting of 177.7 g of rice, 142.8 g of flour and 16.8 g of other cereals. Grain cereal intake decreased slightly between 2002 and 2010–2012. Fruit and fresh vegetable consumption were 40.7 and 269.4 g per day, respectively, and remained stable between 2002 and 2010–2012. Consumption of meat and poultry was 89.7 g, consisting of 64.3 g of pork, 8.2 g of other livestock meat, 2.5 g of internal organs and 14.7 g of poultry meat. Average meat and poultry intake increased by 11.1 g between 2002 and 2010–2012. Consumption of other dairy and meat products included 24.3 g of eggs, 23.7 g of fish and shrimp, 24.7 g of milk, 10.9 g of soybean and other soy products. Milk intake remained at a low level from 2002 to 2010–2012, while consumption of fish and shrimp, and soybean and other soy products decreased by 5.9 and 3.7 g, respectively, and egg consumption remained stable between 2002 and 2010–2012 (figure 8).

Comparison of Chinese adults’ food consumption, Chinese Nutrition and Health Surveillance 2002 and 2010–2012.
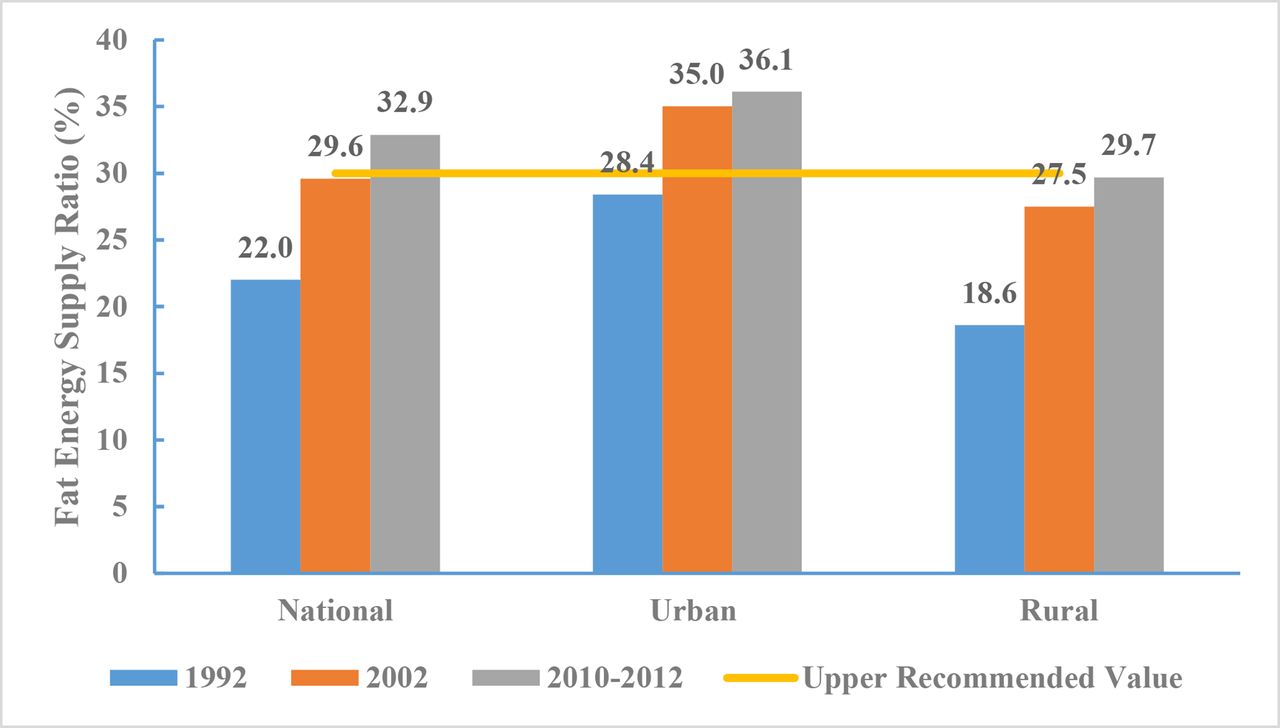
From 2010 to 2012, the proportion of fat-based energy for Chinese adults was 32.9% (36.1% in urban and 29.7% in rural areas). Data from CNHS 1992, 2002 and 2010-2012 indicated that the proportion of energy intake from fat increased over time. According to the Chinese Dietary Guidelines, the recommended upper limit for the proportion of fat-based energy intake is 30%. As such, fat-based energy intake among urban adults exceeded this limit by 6.1%, while that of rural adults approached but did not exceed the limit (figure 9).

Proportion of fat-based energy for Chinese adults by region, Chinese Nutrition and Health Surveillance 1992, 2002 and 2010–2012.
The average daily salt intake among Chinese adults ≥18 years of age was 10.5 g from 2010 to 2012, which is lower than 13.9 g in 1992 and 12.0 g in 2002. The recommended amount of daily salt intake as in Chinese Dietary Guidelines19 is 6 g. As such, the average intake among Chinese adults in 2012 was still 75.0% higher than the recommended value from 2010 to 2012 (figure 10).
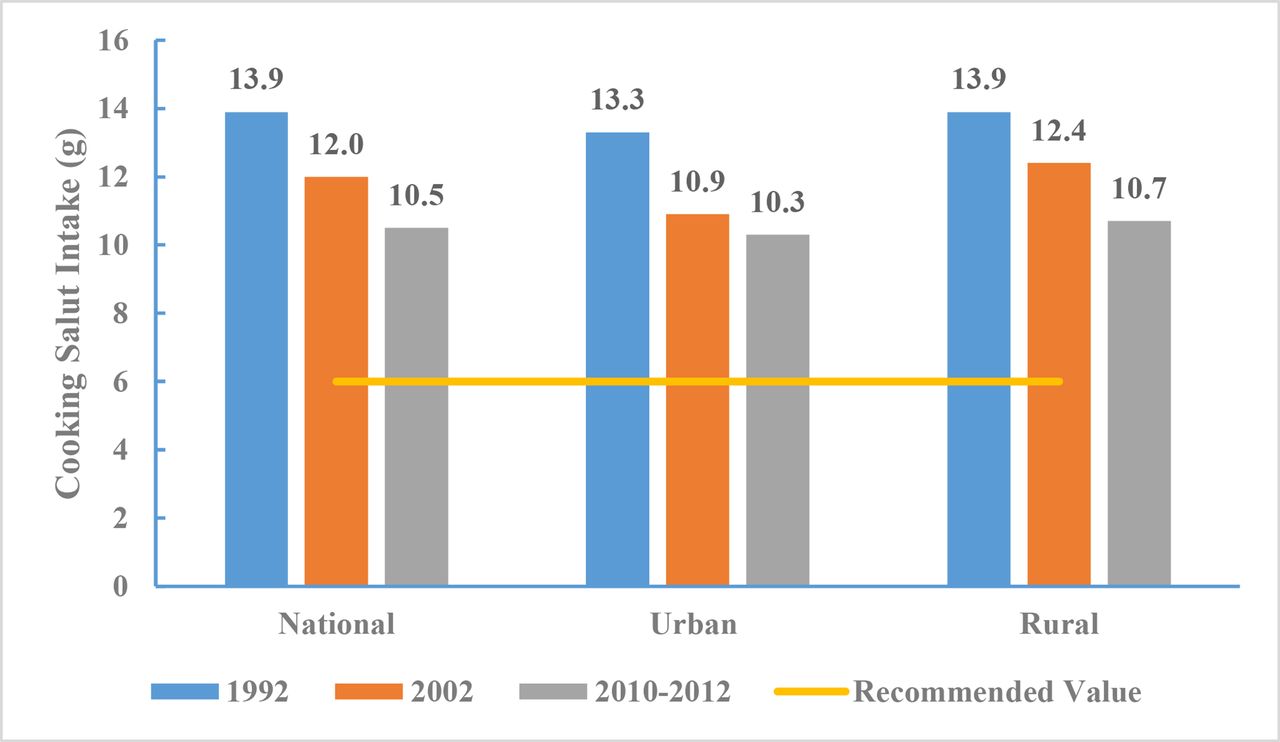
Salt intake for Chinese adults by region, Chinese Nutrition and Health Surveillance 1992, 2002 and 2010–2012.
Overweight and obesity
Classification of overweight and obesity
For adults (≥18 years of age), this was determined using Criteria of Weight for Adults (WS/T 428–2013).20 Being overweight was defined as having a body mass index (BMI) between 24.0 and 27.9 kg/m2. Obesity was defined as having a BMI of ≥28.0 kg/m2. We also used the standards recommended by the WHO21 that overweight is defined as 25.0 kg/m2 ≤BMI<30.0 kg/m2 and obesity was defined as BMI ≥30.0 kg/m2.
Prevalence
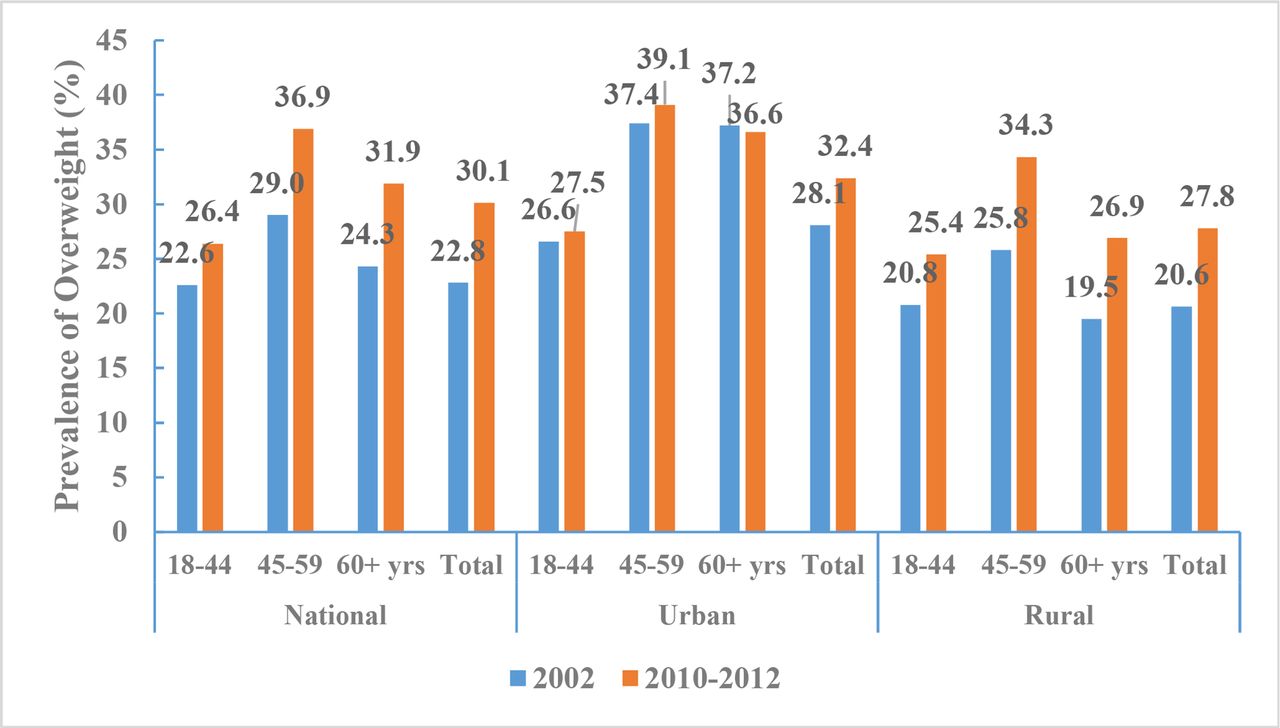
According to CNHS 2010–2012, the aged-adjusted prevalence of being overweight among Chinese adults (≥18 years of age) was 30.1% (30.3% of men and 29.9% of women, 32.4% in urban areas and 27.8% in rural areas), and the prevalence of obesity was 11.9% (12.1% of men and 11.7% of women, 13.2% in urban areas and 10.5% in rural areas). These BMI cut-offs for defining overweight and obesity are based on the Chinese standard. In contrast, the aged-adjusted prevalences of overweight or obesity were lower when defined according to the WHO standard (27.1% and 5.2%, respectively). The age-standardised prevalences of overweight or obesity increased significantly from 2002 to 2010–2012; using BMI definitions according to the Chinese standard, we found that the prevalence of overweight increased from 22.8% to 30.1% (figure 11) and the prevalence of obesity increased from 7.1% to 11.9% (figure 12).

Prevalence of overweight among Chinese adults by regions and age groups, Chinese Nutrition and Health Surveillance 2002 and 2010–2012 (Chinese standard for body mass index).

Prevalence of obesity among Chinese adults by regions and age groups, Chinese Nutrition and Health Surveillance 2002 and 2010–2012 (Chinese standard for body mass index).
High blood pressure
Definitions
Hypertension of adults (≥18 years of age) is defined as systolic blood pressure≥140 mm Hg and/or diastolic blood pressure≥90 mm Hg, or self-reported antihypertensive medicine use over the past 2 weeks.
Rate of hypertension awareness refers to the proportion of individuals having known hypertension (diagnosed by qualified medical institutions or doctors) and subsequently confirmed in the survey.
Rate of hypertension treatment refers to the proportion of individuals in the survey taking antihypertensive drugs over the past 2 weeks.
Rate of hypertension control refers to the proportion of individuals whose blood pressure was controlled to a level below 140/90 mm Hg after treatment.
Rate of hypertension treatment and control refers to the proportion of individuals whose blood pressure is controlled to a level <140/90 mm Hg among patients who have taken antihypertensive drugs over the past 2 weeks.
Prevalence
In 2002, the prevalence of hypertension was 18.8% among all Chinese adults and has increased since then. The age-adjusted prevalence of hypertension among Chinese adults ≥18 years of age was 25.2% in CNHS from 2010 to 2012 (26.2% for men and 24.1% for women, 26.8% for urban and 23.5% for rural) (table 7). This equates to an estimated 265.2 million adults who have high blood pressure (139.5 million men and 125.7 million women). Between 2010 and 2012, the prevalence of high blood pressure was 10.6% among those 18–44 years of age, 35.7% among those 45–59 years of age and 58.9% among those ≥60 years of age.
Prevalence of hypertension for adults ≥18 years of age by region and sex, Chinese Nutrition and Health Surveillance 2010–2012
According to the data from China PEACE,12 44.7% of the study population had hypertension, including 15.2% with stage II hypertension. Hypertension prevalence increased with age (figure 13). The overall age-standardised and sex-standardised rate of hypertension prevalence was 37.2%.

Prevalence of hypertension aged 35–75 years, China Patient-Centered Evaluative Assessment of Cardiac Events (PEACE) Million Persons Project 2014–2017.
Awareness, treatment and control
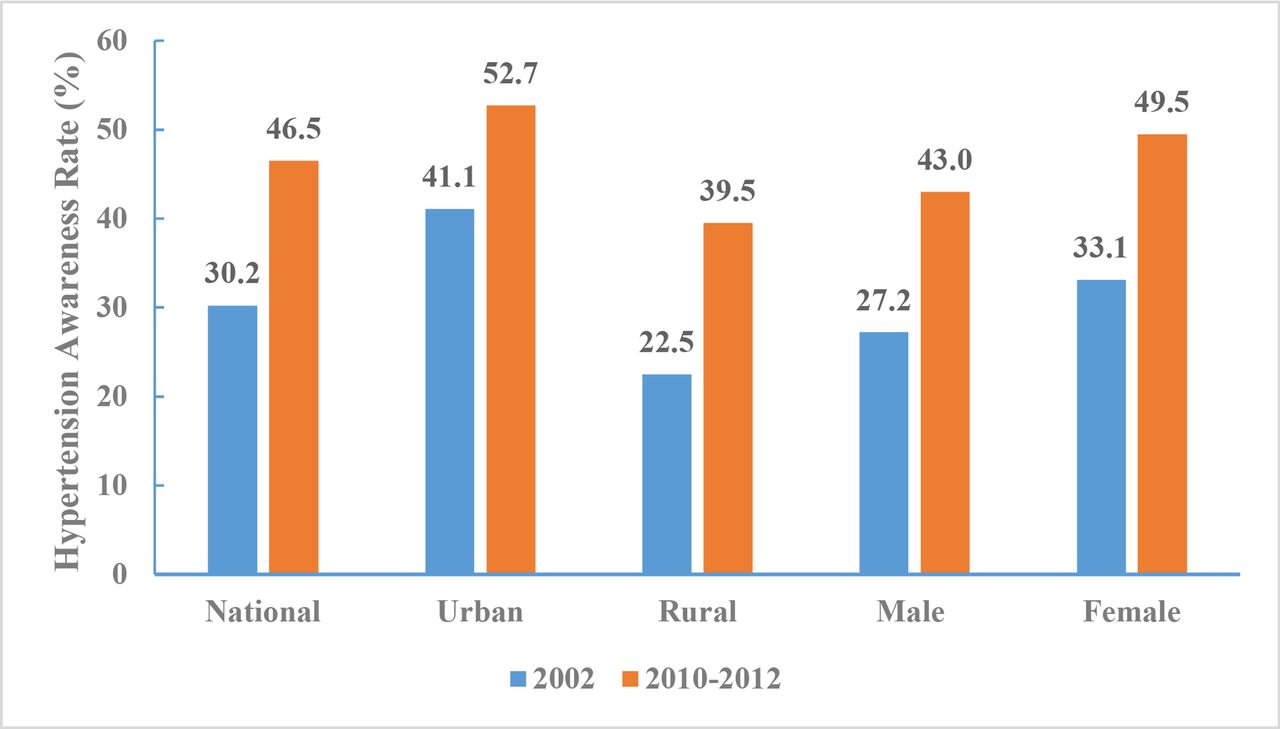
In 2010–2012, the rate of hypertension awareness among adults was 46.5% (43.0% for men and 49.5% for women). There was a significant difference in the awareness rate of hypertension among urban (52.7%) and rural (39.5%) adults. Analysis of CNHS 2002 and 2010–2012 found the proportion of adults aware of their hypertension increased within each subgroup by region and sex. The largest increase in the rate of hypertension awareness (17%) occurred among those living in rural areas (figure 14).

Hypertension awareness rate of Chinese adults aged 18 years and above by region and sex, Chinese Nutrition and Health Surveillance 2002 and 2010–2012.
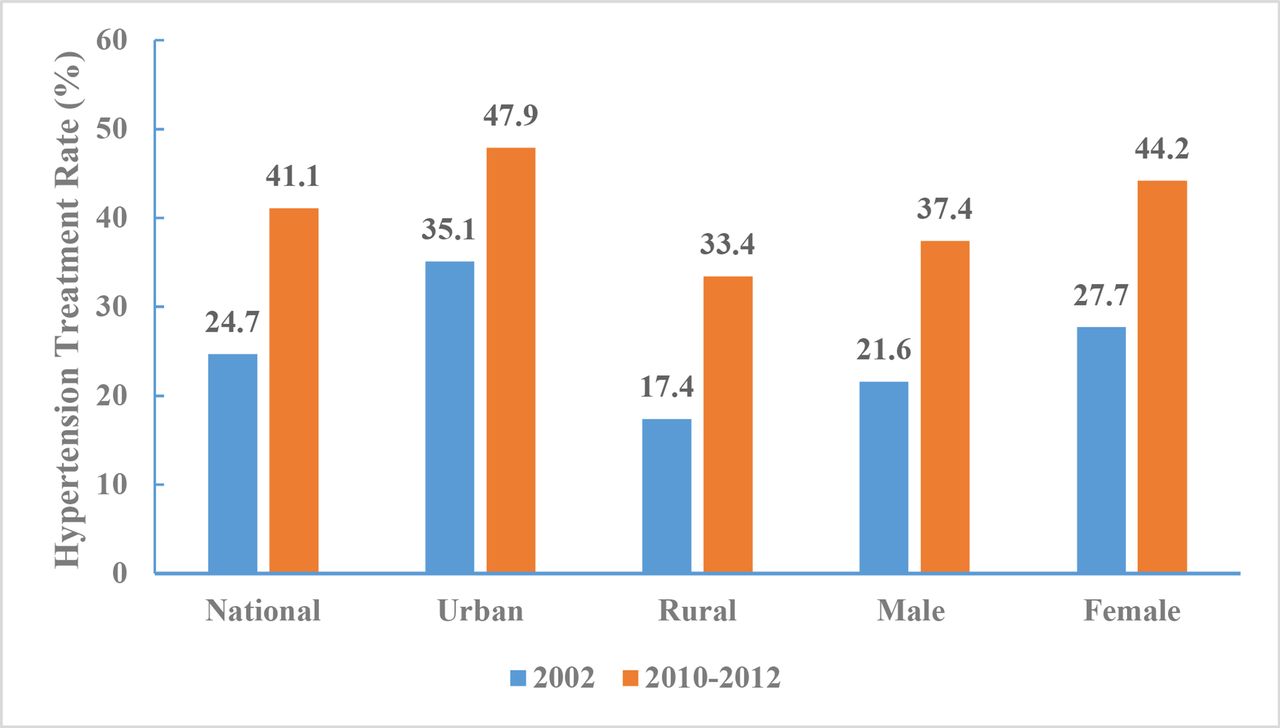
In 2010–2012, the rate of hypertension treatment among adults was 41.1% (37.4% for men and 44.2% for women). There was a significant difference in the treatment rate of hypertension among urban (47.9%) and rural (33.4%) adults, and the proportion of adults treated increased within each subgroup by region and sex. The largest increase in the rate of treatment (16.5%) occurred among women (figure 15).

Hypertension treatment rate of Chinese adults aged 18 years and above by region and sex, Chinese Nutrition and Health Surveillance 2002 and 2010–2012.
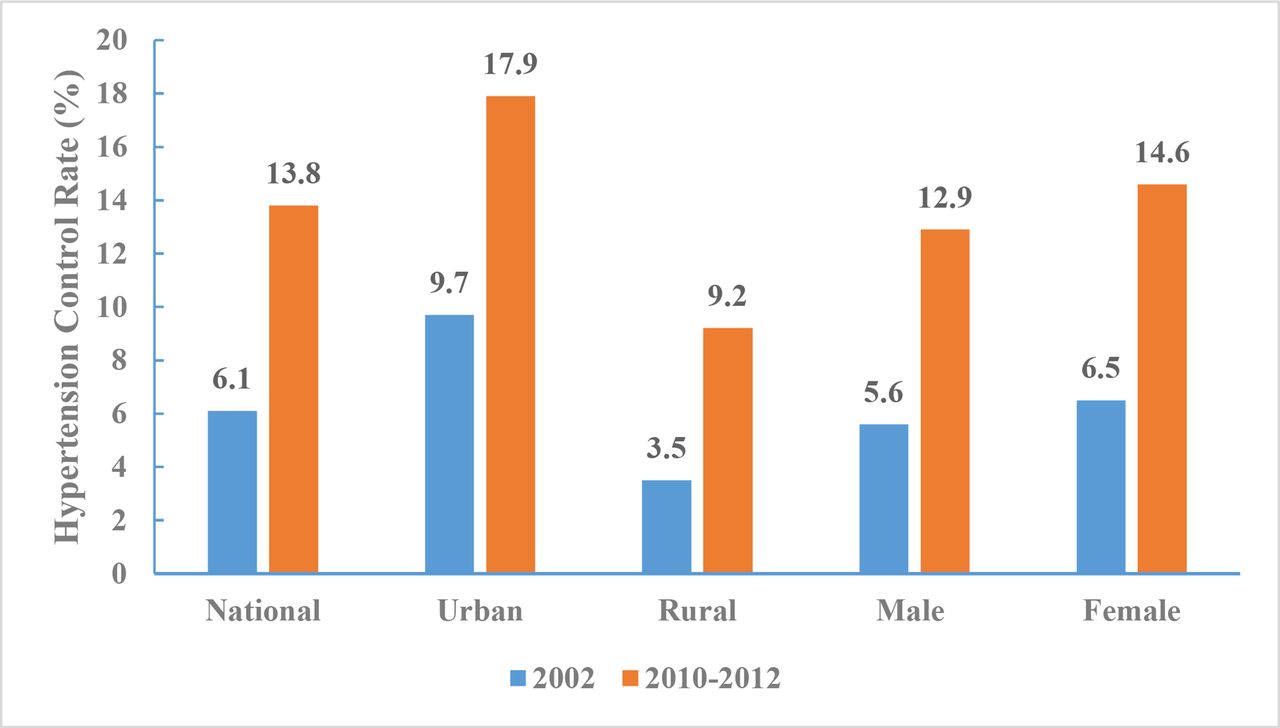
In 2010–2012, the hypertension control rate among Chinese adults ≥18 years was 13.8% (12.9% for men and 14.6% for women). Significant differences in the rate of control was observed between urban (17.9%) and rural (9.2%) adults, and the control rate increased within each subgroup by region and sex. Similar to trends observed in hypertension treatment rate, the largest increase in control rate (8.1%) was also among women (figure 16).

Hypertension control rates for Chinese adults aged 18 years and above by region and sex, Chinese Nutrition and Health Surveillance 2002 and 2010–2012.
From 2010 to 2012, the rate of hypertension treatment and control among Chinese adults aged 18 years and above was 33.6% (34.5% for men and 32.9% for women). A significant difference was observed between urban (37.3%) and rural (27.6%) adults, and the proportion with controlled hypertension increased within each subgroup by region and sex. The largest increase (9.1%) occurred in urban areas (figure 17).
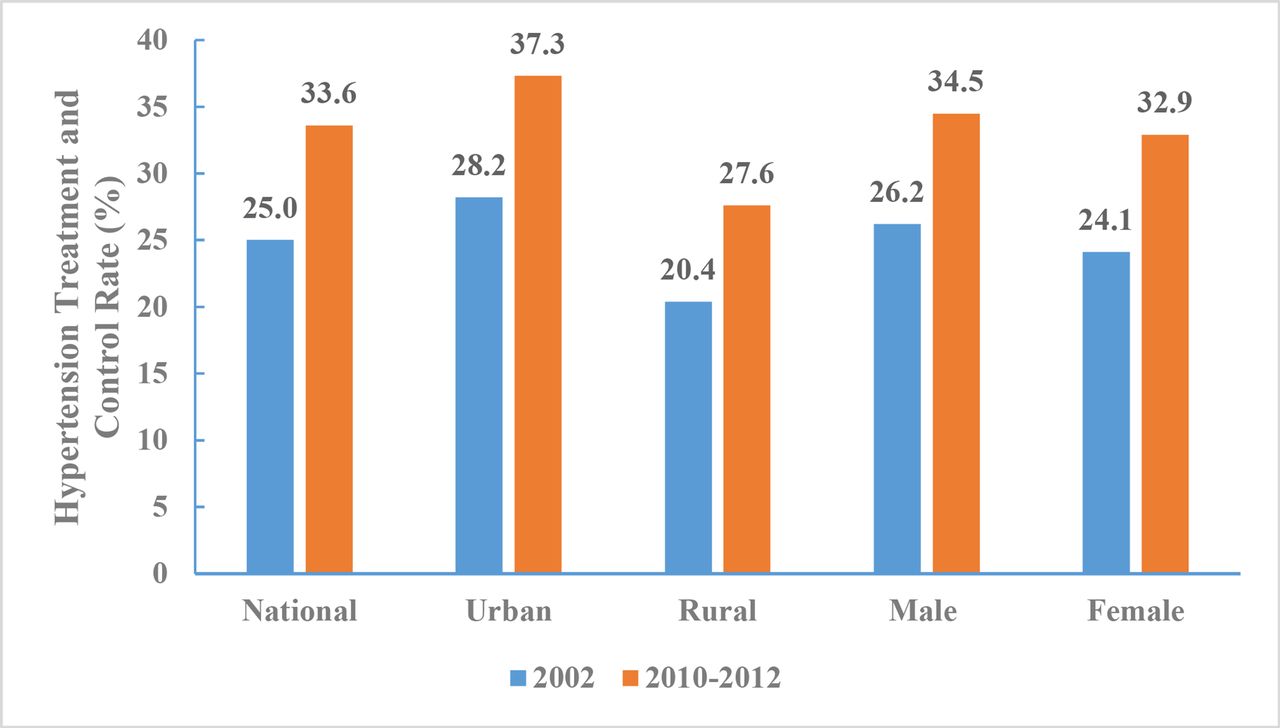
Hypertension treatment and control rates for Chinese adults aged 18 years and above by region and sex, Chinese Nutrition and Health Surveillance 2002 and 2010–2012.
According to the data from China PEACE,12 44.7% participants were aware of their diagnosis; 30.1% were taking prescribed antihypertensive medications; and 7.2% had achieved control. The age-standardised and sex-standardised rates of hypertension awareness, treatment and control were 36.0%, 22.9% and 5.7%, respectively.
Diabetes mellitus
Definitions
Diagnosed diabetes is defined as self-reported but previously diagnosed by a healthcare professional. If no self-reported diagnosis exists, undiagnosed diabetes is defined according to the American Diabetes Association 2010 criteria, which includes fasting plasma glucose level of ≥126 mg/dL, 2-hour plasma glucose level of ≥200 mg/dL (after 75 g glucose ingestion) or an Hemoglobin A1c (HbA1c) level of ≥6.5%. Total diabetes prevalence is calculated by combining diagnosed and undiagnosed cases.
Pre-diabetes is identified as those who have no diabetes but have an HbA1c level between 5.7% and 6.4%, fasting plasma glucose level between 100 and 125 mg/dL, or 2-hour plasma glucose level between 140 and 199 mg/dL.
Awareness rate is defined as the proportion of individuals with physician-diagnosed diabetes among all patients with diagnosed or undiagnosed diabetes.
Treatment rate is defined as the proportion of individuals receiving diabetic treatment medications among all patients with diabetes.
Control rate is defined as the proportion of individuals with an HbA1c level of <7.0% among patients with diabetes who are taking diabetic treatment medications.
Prevalence
According to the data from China CDRFS 2013, the standardised prevalence of diabetes in Chinese adults was estimated at 10.9%, with 10.2% in women and 11.7% in men. The prevalence of diabetes was higher in older patients, men and urban residents. The estimated prevalence of pre-diabetes was 35.7%, with 35.0% in women and 36.4% in men. The prevalence of pre-diabetes was also higher in older patients.
Awareness, treatment and control
The diabetes awareness rate was 36.5% (39.8% for women, 33.5% for men). The treatment rate was 32.2% and the control rate was 49.2%. The awareness rate and treatment rate were higher in older, female and urban residents. The control rate was higher in younger and urban residents (table 8).
Weighted prevalence, awareness rate, treatment rate and control rate of diabetes among Chinese adults from China Chronic Disease and Risk Factors Surveillance in 2013
High blood cholesterol and other lipids
Definitions
According to the guidelines of Chinese Adult Dyslipidaemia Prevention and Treatment (2016 revised edition),22 a serum total cholesterol concentration greater than 6.22 mmol/L (240 mg/dL) is considered hypercholesterolaemia; triglyceride greater than 2.26 mmol/L (200 mg/dL) is considered hypertriglyceridaemia; low-density lipoprotein cholesterol (LDL-c) greater than 4.14 mmol/L (160 mg/dL) is considered high LDL-c; and high-density lipoprotein cholesterol (HDL-c) lower than 1.04 mmol/L (40 mg/dL) is considered low HDL-c.
Prevalence
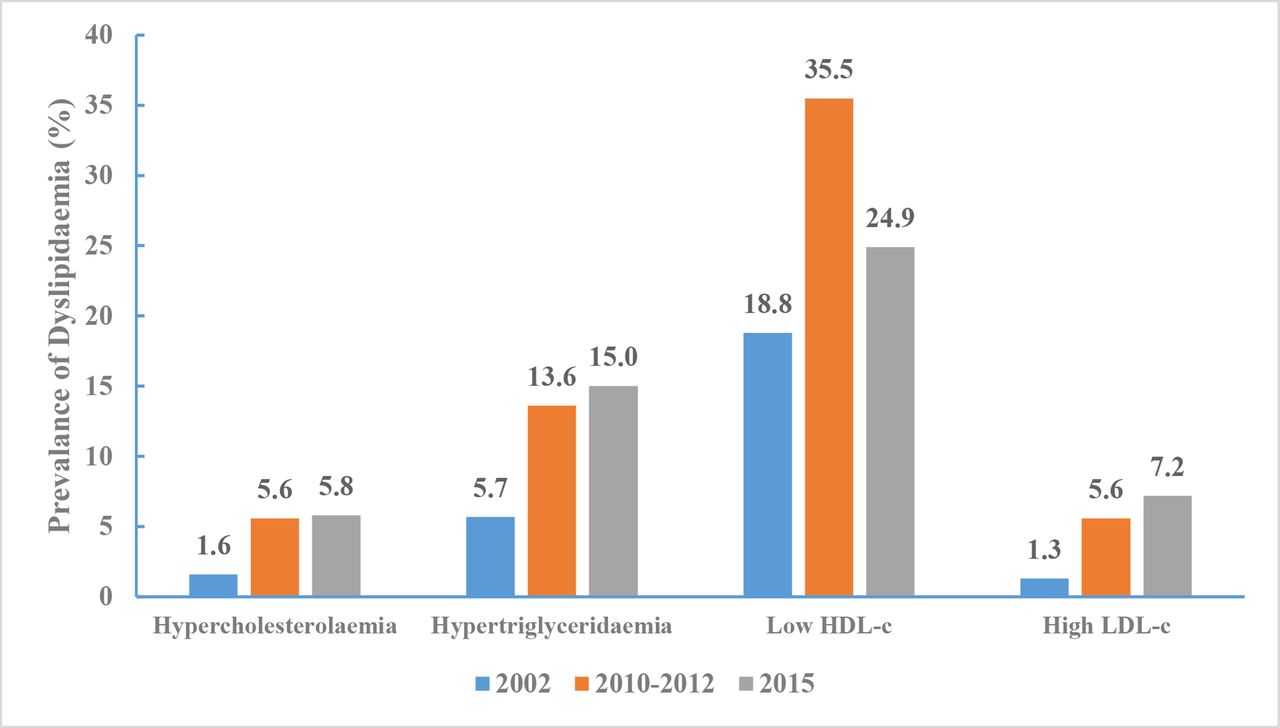
The adjusted prevalence of hypercholesterolaemia was 1.6% (95% CI 1.3% to 1.8%) in 2002, increased to 5.6% (95% CI 5.1% to 6.1%) in 2010 and then increased to 5.8% (95% CI 5.3% to 6.3%) in 2015 (p for trend <0.001). Hypertriglyceridaemia prevalence dramatically increased from 5.7% (95% CI 5.1% to 6.3%) to 13.6% (95% CI 12.9% to 14.2%) and then to 15.0% (95% CI 14.3% to 15.7%). Low HDL-c prevalence changed remarkably over these years, increasing from 18.8% (95% CI 17.0% to 20.6%) to 35.5% (95% CI 33.3% to 37.6%) and then to 24.9% (95% CI 23.5% to 26.4%). Similarly, high LDL-c prevalence increased from 1.3% to 5.6% and then to 7.2% over the 13-year interval (figure 18).

Prevalence of dyslipidaemia in Chinese adults aged 18 years and above, Chinese Nutrition and Health Surveillance 2002, 2010–2012 and 2015.
Screening, awareness and treatment
Between 2010 and 2012, the percentage of adults who reported having had a cholesterol check was 26.2% (26.4% for men and 26.0% for women, 38.2% in urban areas and 13.8% in rural areas). The percentages of adults who reported having had a cholesterol check by age group were 16.6% for those 18–44 years of age, 26.7% for those 45–59 years of age, and 35.3% for those 60 years of age and above. The percentage of adults who reported having had a cholesterol check increased from 6.4% to 26.2% between 2002 and 2010–2012 (figure 19).

Percentage of adults who reported having had a cholesterol check by regions and sex, Chinese Nutrition and Health Surveillance 2002 and 2010–2012.
Between 2010 and 2012, dyslipidaemia awareness rate was 8.3% (8.2% for men and 8.4% for women, 11.7% in urban areas and 4.7% in rural areas). The dyslipidaemia awareness rate was 3.3% for those 18–44 years of age, 8.8% for those 45–59 years of age, and 12.4% for those 60 years and above. The dyslipidaemia awareness rate increased from 3.2% in 2002 to 8.3% during 2010–2012 (figure 20).
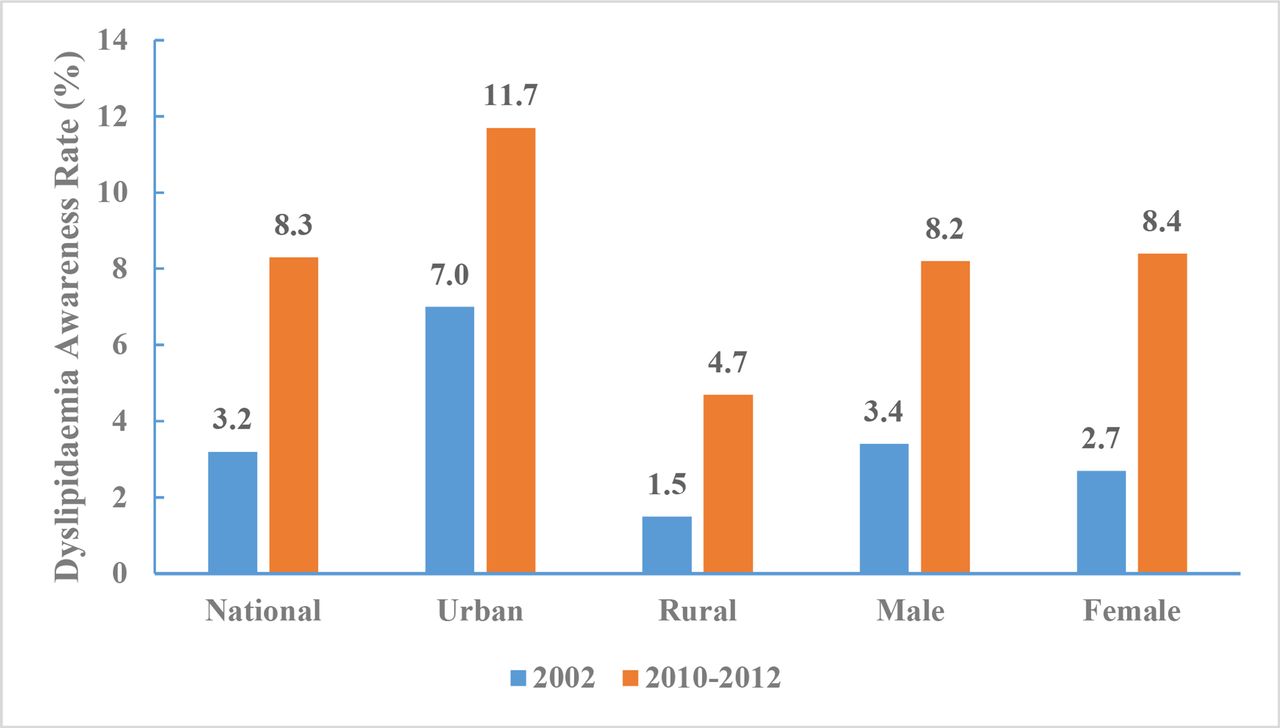
Dyslipidaemia awareness rate of Chinese adults aged 18 years and above by region and sex, Chinese Nutrition and Health Surveillance 2002 and 2010–2012.
Between 2010 and 2012, dyslipidaemia treatment rate among Chinese adults ≥18 years of age was 7.0% (6.9% for men and 7.2% for women, 10.0% in urban areas and 3.8% in rural areas). The dyslipidaemia treatment rates by age group were 2.6% in for those between 18 and 44 years of age, 7.2% for those between 45 and 59 years of age, and 11.0% for those ≥60 years of age. Dyslipidaemia treatment rate increased from 2.5% in 2002 to 7.0% between 2010 and 2012 (figure 21).

Dyslipidaemia treatment rate of Chinese adults aged 18 years and above by region and sex, Chinese Nutrition and Health Surveillance 2002 and 2010–2012.
Atrial fibrillation
Definitions
Individuals with AF is identified based on a self-reported history of persistent AF or identified based on results of previous ECG or ECG examinations during the survey.
Prevalence
According to the data from the CNSSPP in all provinces other than Tibet from October 2014 to November 2015, the standardised prevalence of AF among Chinese adults aged ≥40 years was 2.31% (95% CI 2.28% to 2.33%). The prevalence increased with age, from 1.13% among adults aged between 40 and 49 years to 4.57% among adults aged ≥70 years. AF prevalence was higher among women compared with men (2.72% vs 1.90%) and higher among rural residents compared with urban residents (2.42% vs 2.19%)14 (figure 22).
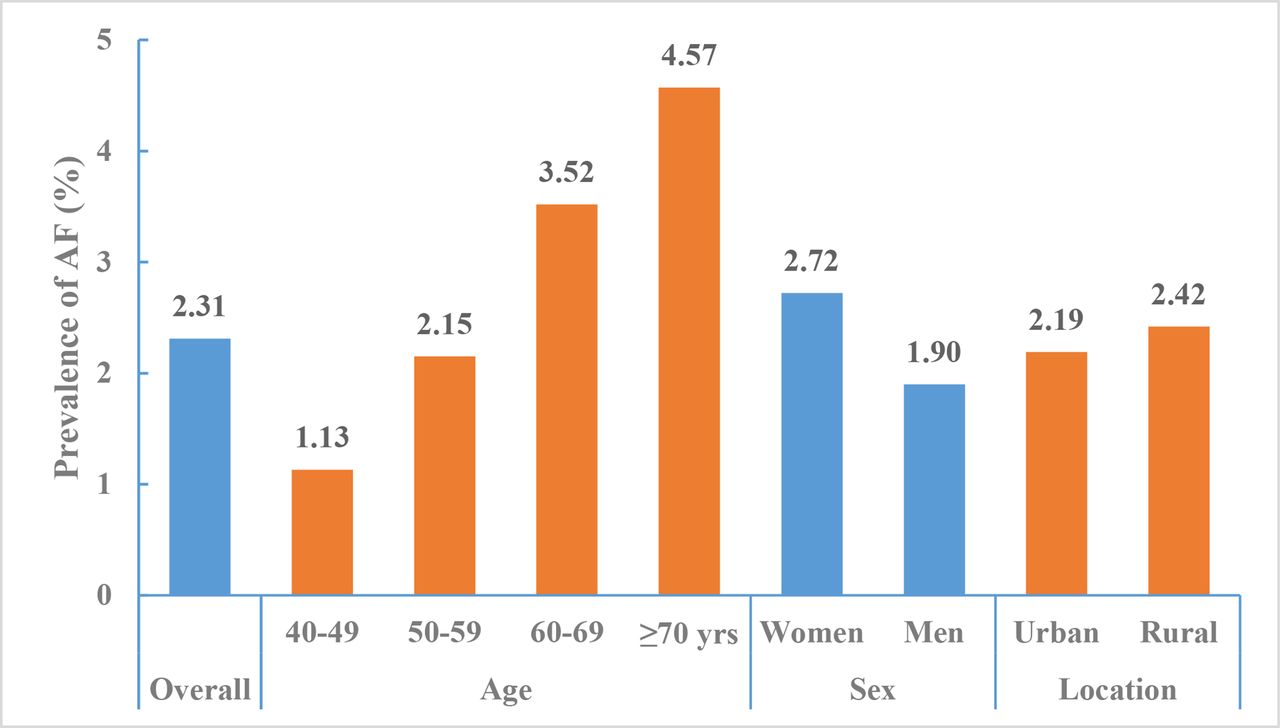
Prevalence of atrial fibrillation among adults aged ≥40 years by region and sex, China National Stroke Screening and Prevention Project 2014–2015.
Inpatient stroke care management and quality
Admission
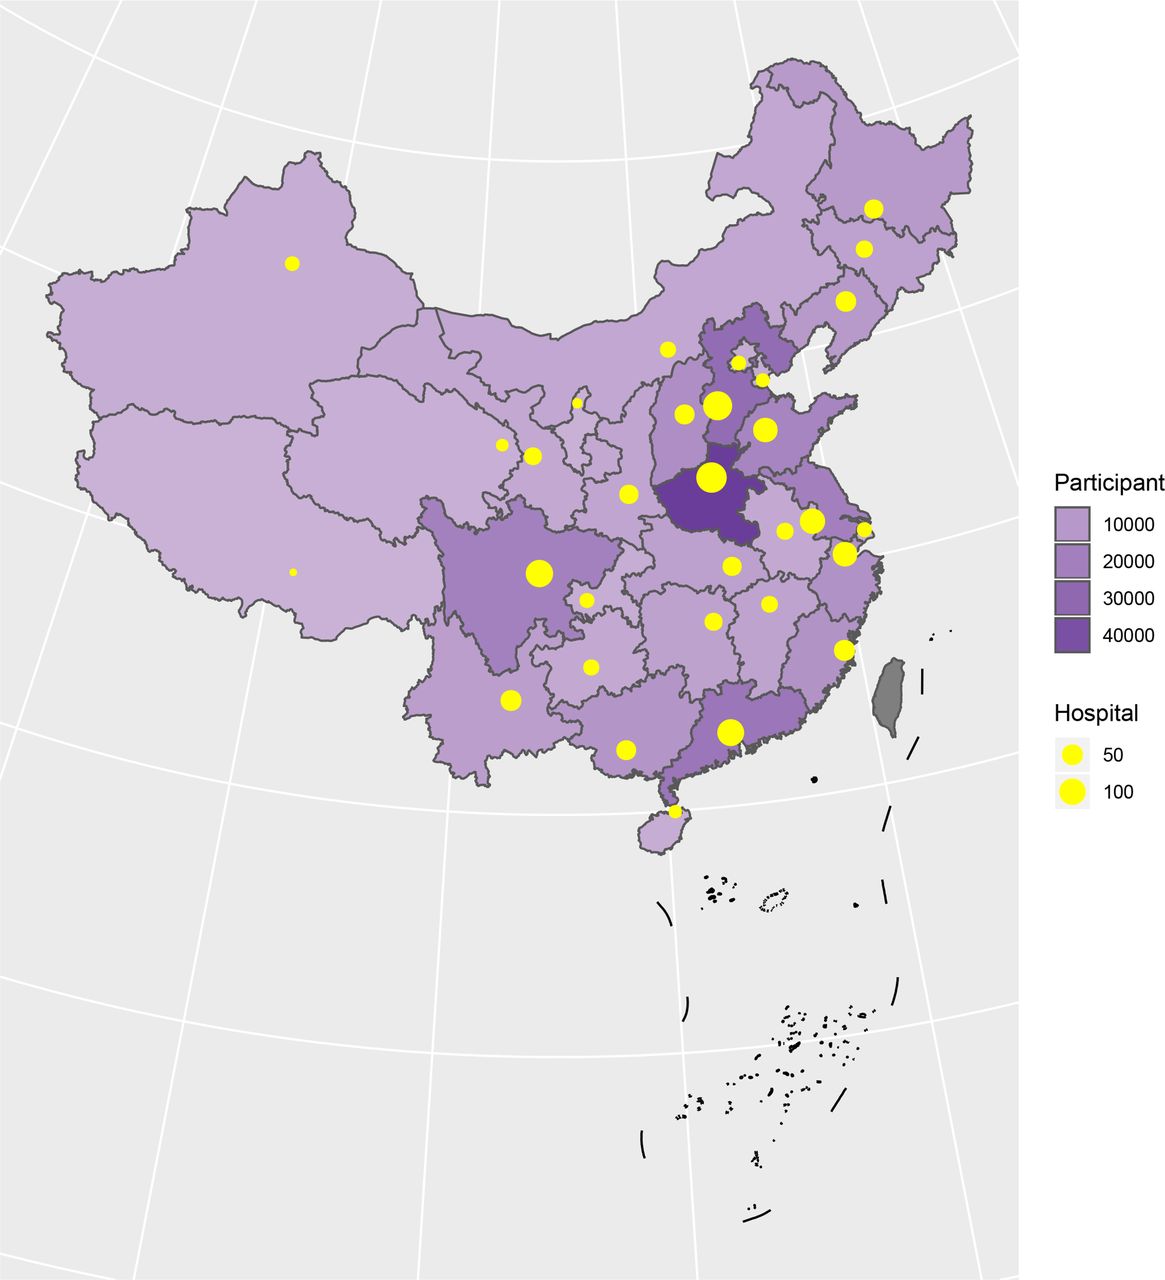
A total of 3 010 204 stroke patients admitted in 2018 were identified from HQMS among 1853 tertiary hospitals (figure 23). Of those, 2 466 785 (81.9%) were ISs, 447 609 (14.9%) were intracerebral haemorrhagic strokes, and 95 810 (3.2%) were subarachnoid haemorrhages (SAHs). Patients with IS were primarily admitted from the clinic (53.9%) and patients with intracerebral haemorrhage (ICH) were primarily admitted from the emergency room (55.0% for ICH and 58.9% for SAH). All patients with stroke were more likely to be admitted on weekdays, especially on Mondays, and were less likely to be admitted on weekends (table 9).
Admission of in-patients with stroke from Hospital Quality Monitoring System in 2018

Distribution of hospitals and participants from the Hospital Quality Monitoring System in 2018.
Patients characteristics: sex, age and medical insurance
Among the 3 010 204 patients with stroke admitted to 1853 tertiary hospitals across China, nearly 60% were male. The average age was 66 (SD 12.8), and the median age was 67 (IQR 57.0–76.0). Most patients were covered by the urban resident basic medical insurance (URBMI) (35.3%), followed by the urban employee basic medical insurance (UEBMI) (23.2%) and new rural cooperative medical schema (NRCMS) (16.3%). Only 10.7% were self-pay (including off-site medical treatment of insured patients). For ISs and ICHs, a higher number of male patients were admitted compared with female patients. In contrast, more patients with SAH were female. Compared with other stroke subtypes, patients with SAH were younger and a higher proportion was self-pay (table 10).
Characteristics of in-patients with stroke from the Hospital Quality Monitoring System in 2018
Geographical distribution
Liaoning province contributed the largest number of patients for this report (8.4%), followed by Guangdong (7.6%) and Shandong (7.2%). Tibet contributed less than 1% (table 11).
Geographical distribution of in-patients with stroke from the Hospital Quality Monitoring System in 2018
Stroke subtypes by geographical area
The proportion of each stroke subtype varied by province. Tibet had the highest proportion of ICH (61.3%), followed by Qinghai (44.2%) and Guizhou (34.9%) (figure 24).

Proportion of stroke type for in-hospital patients with stroke from the Hospital Quality Monitoring System in 2018 stratified by province.
Age distribution stratified by sex and stroke subtype
The proportions of strokes occurring in those under 18 years of age were 0.1% for IS, 0.6% for ICH and 1.4% for SAH. Male patients had higher proportions of strokes occuring in each age groups under 65 years than female patients (tables 12–14).
Inpatients with ischaemic stroke from the Hospital Quality Monitoring System in 2018 by age and sex
Inpatients with intracerebral haemorrhage from the Hospital Quality Monitoring System in 2018 by age and sex
In-patients with subarachnoid haemorrhage from the Hospital Quality Monitoring System in 2018 by age and sex
Risk factors or comorbidities
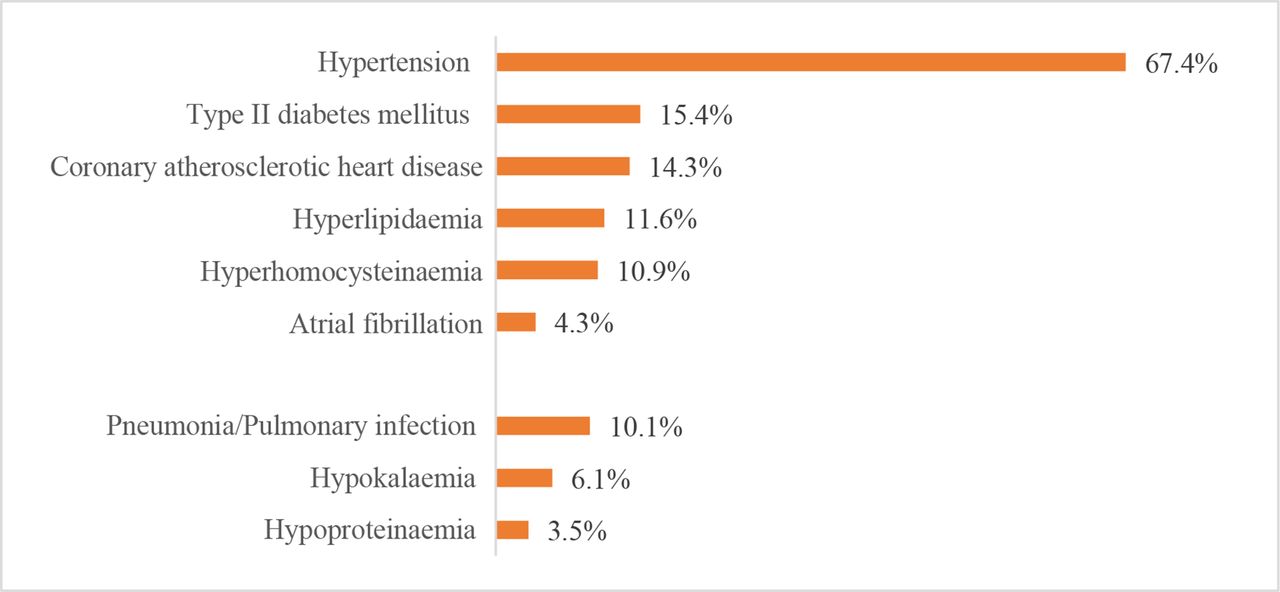
The leading risk factor for stroke was hypertension, which was present in 1 663 252 (67.4%) patients with IS, 345 572 (77.2%) patients with ICH and 47 008 (49.1%) patients with SAH. The leading comorbidity was pneumonia or pulmonary infection, which was present in 248 656 (10.1%) patients with IS, 140 338 (31.4%) patients with ICH and 24 111 (25.2%) patients with SAH. Other risk factors and comorbidities are shown in figures 25–27.

Risk factors or comorbidities for patients with ischaemic stroke from the Hospital Quality Monitoring System in 2018.

Risk factors or comorbidities for patients with intracerebral haemorrhage from the Hospital Quality Monitoring System in 2018.

Risk factors or comorbidities for patients with subarachnoid haemorrhage from the Hospital Quality Monitoring System in 2018.
In-hospital management
We first assessed key performance indicators based on the national guidelines using the CSCA data from 2018. A total of 297 327 strokes (269 428 IS, 24 556 ICH and 3343 SAH) from 1377 hospitals were analysed (figure 28). The composite scores for patients with IS, ICH and SAH were 0.77±0.21, 0.72±0.28 and 0.59±0.32, respectively. The all-of-null measures for patients with IS, ICH and SAH were 27.1 (26.9–27.3), 37.3 (36.7–37.9) and 25.3 (23.9–26.8), respectively. Other indicators are shown in tables 15–17.
Key performance indicators of ischaemic stroke from Chinese Stroke Center Alliance in 2018
Key performance indicators of intracerebral haemorrhage from Chinese Stroke Center Alliance in 2018
Key performance indicators of subarachnoid haemorrhage from Chinese Stroke Center Alliance in 2018

Distribution of hospitals and participants from Chinese Stroke Center Alliance in 2018.
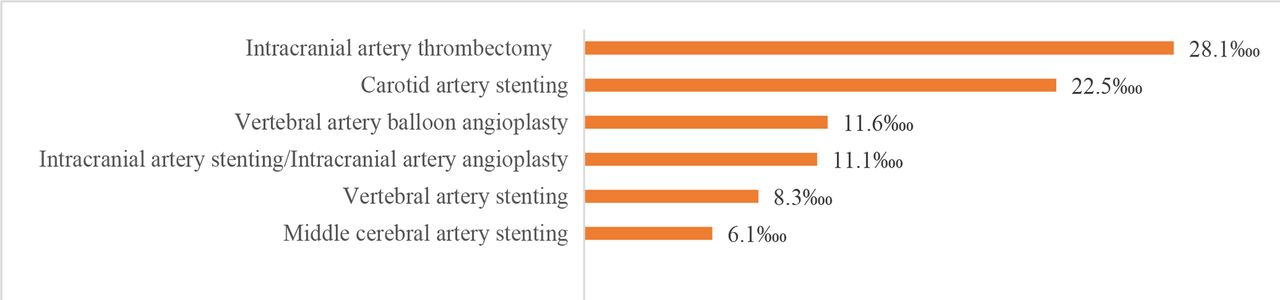
We also evaluated procedures and operations using the HQMS 2018 data. The most common procedures for patients with IS in HQMS were intracranial intra-arterial thrombectomy (6923 (28.1‱)) and carotid artery stenting (5540 (22.5‱)). The most common procedures for patients with ICH in HQMS were the evacuation of intracerebral haematoma/evacuation of intracranial haematoma/transtemporal evacuation of intracerebral haematoma (41 705 (9.3%)) and burr-hole drainage of ventricle/burr-hole decompression of skull (18 142 (4.1%)). For patients with SAH in HQMS, the most common interventions were intracranial aneurysm embolisation/intracranial aneurysm coil embolisation/intracranial aneurysm embolisation/middle cerebral aneurysm embolisation (15 895 (16.6%)) and intracranial arterial stenting/intracranial arterial stent-assist coil embolisation (2818 (2.9%)). The most common procedure for patients with SAH in HQMS was the clipping of aneurysms (4743 (4.9%)). Prevalence of other procedures and interventions are shown in figures 29–32.

Procedures for patients with ischaemic stroke from the Hospital Quality Monitoring System in 2018.

Procedures for patients with intracerebral haemorrhage from the Hospital Quality Monitoring System in 2018.
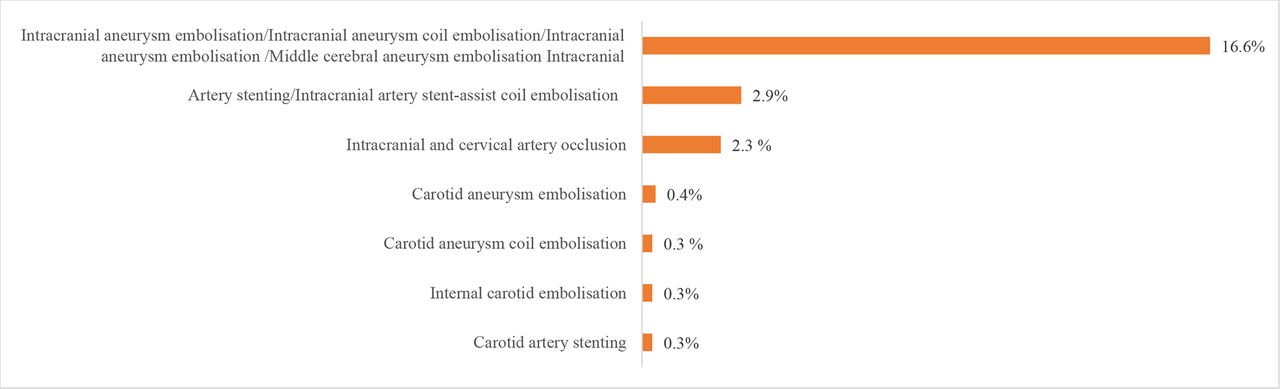
Intervention for patients with subarachnoid haemorrhage from the Hospital Quality Monitoring System in 2018.

Proceduresfor patients with subarachnoid haemorrhage from the Hospital Quality Monitoring System in 2018.
In-hospital outcomes
About 87% of hospitalised patients with stroke were discharged as planned. However, 8.3% were discharged against medical advice (DAMA) or died during hospitalisation. The mean length of stay was 12.4±10.5 days, with median and IQR at 10.0 (7.0–14.0) days. The average fee for the care of one patient with stroke was about 18 555 yuan (RMB), and average out-of-pocket spending was about 5765 yuan (RMB). More patients with ICH and SAH stroke were discharged against medical advice or died during hospitalisation and had higher total fees and out-of-pocket spending than those with IS (table 18).
In-hospital outcomes of patients with stroke from the Hospital Quality Monitoring System in 2018
In-hospital outcomes were reported by sex. Female patients with stroke had lower cost of care for ischaemic stroke and ICH but higher cost of care for SAH compared with male patients with stroke (tables 19–21).
In-hospital outcomes of patients with ischaemic stroke from the Hospital Quality Monitoring System in 2018 by sex
In-hospital outcomes of patients with intracerebral haemorrhage from the Hospital Quality Monitoring System in 2018 by sex
In-hospital outcomes of patients with subarachnoid haemorhage from the Hospital Quality Monitoring System in 2018 by sex
In-hospital outcomes were also reported by stroke subtypes and insurance status. Patients with stroke covered by URBMI had the lowest DAMA rate and the highest in-hospital death rate. Conversely, patients with stroke covered by NRCMS had the highest DAMA rate and the lowest in-hospital death rate. Other in-hospital outcomes such as length of stay, total fees and out-of-pocket spending are shown in tables 22–24.
In-hospital outcomes of patients with ischaemic stroke from the Hospital Quality Monitoring System in 2018 by insurance
In-hospital outcomes of patients with intracerebral haemorrhage from the Hospital Quality Monitoring System in 2018 by insurance
In-hospital outcomes of patients with subarachnoid haemorrhage from the Hospital Quality Monitoring System in 2018 by insurance
Outcomes of hospitalised patients were also stratified by the admission day (weekday vs weekend). Patients with stroke admitted on weekdays had lower DAMA/death rate and lower total costs than those admitted on weekends (tables 25–27).
In-hospital outcomes of patients with ischaemic stroke from the Hospital Quality Monitoring System in 2018 by admission day
In-hospital outcomes of patients with intracerebral haemorrhage from the Hospital Quality Monitoring System in 2018 by admission day
In-hospital outcomes of patients with subarachnoid haemorrhagefrom the Hospital Quality Monitoring System in 2018 by admission day
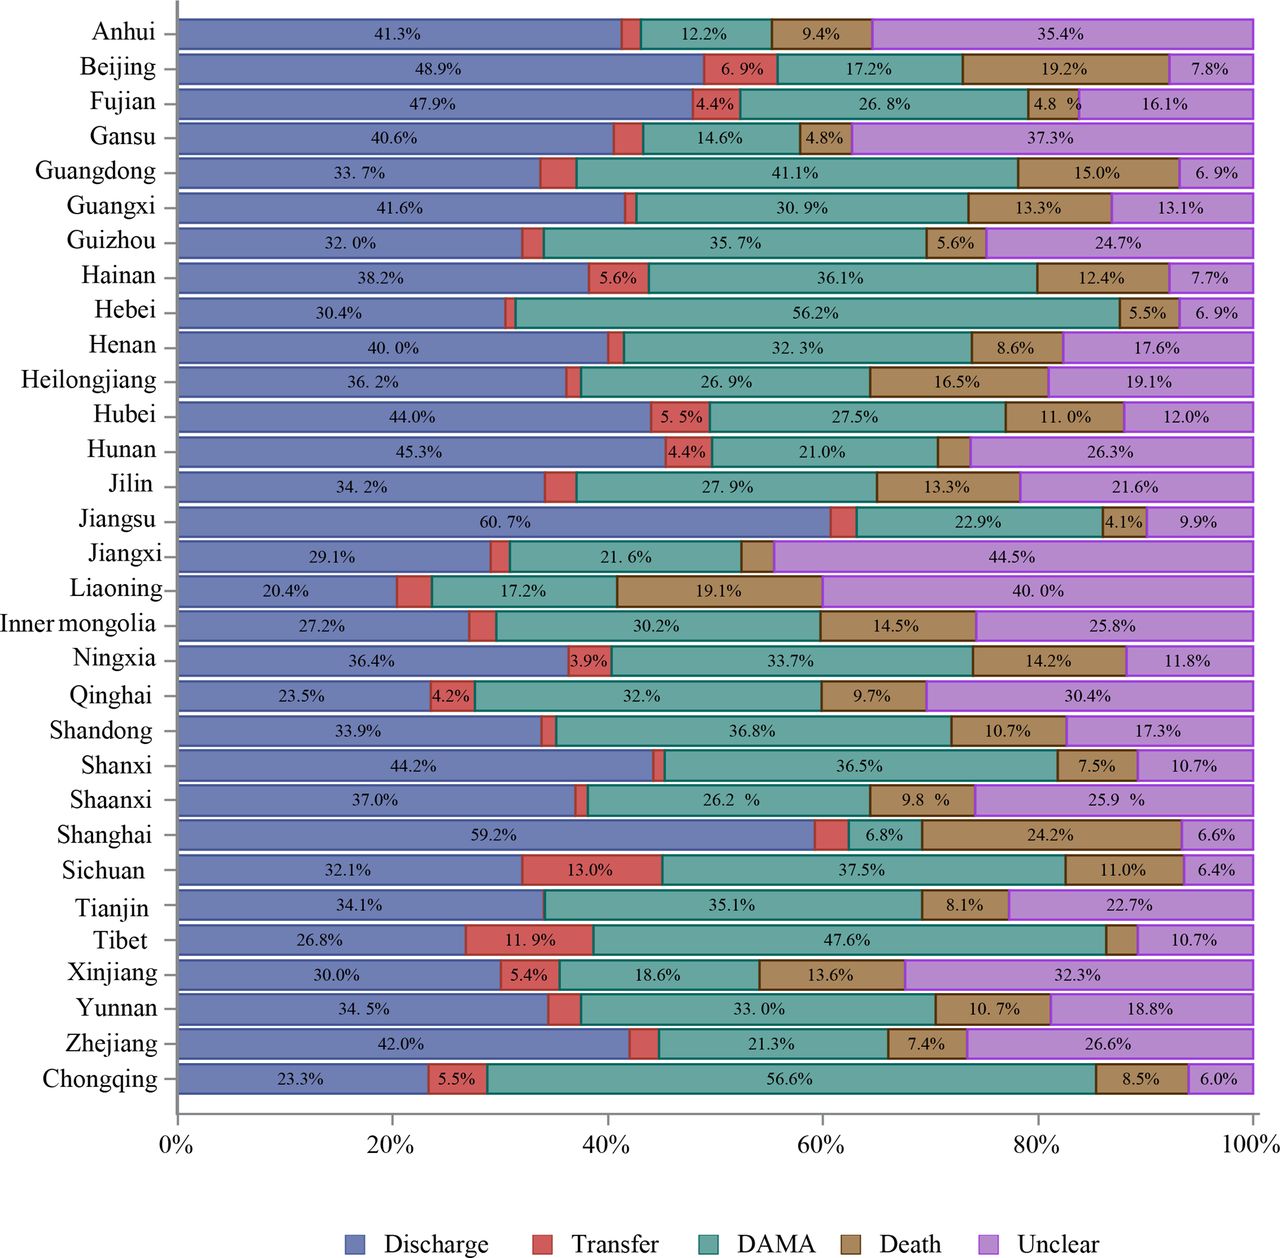
Outcomes of hospitalised patients were also stratified by provinces and stroke subtypes. Data from HQMS 2018 showed that Chongqing and Hebei had the highest DAMA rates (figure 33), while Shanghai had the highest rate of in-hospital deaths (figures 34 and 35).

In-hospital outcomes of patients with ischaemic stroke from the Hospital Quality Monitoring System in 2018 by province, autonomous region, or municipality. DAMA, discharge against medical advice.

In-hospital outcomes of patients with intracerebral haemorrhage from the Hospital Quality Monitoring System in 2018 by province, autonomous region, or municipality. DAMA, discharge against medical advice.

In-hospital outcomes of patients with subarachnoid haemorrhage from the Hospital Quality Monitoring System in 2018 by province, autonomous region, or municipality. DAMA, discharge without medical advice.
Discussion
The crude death rate from stroke has been increasing rapidly in China over the past three decades, rising at a faster rate than that of other countries. Ageing has become one of the major contributors to the increased mortality from stroke. In 2018, 11.9% of China’s population was over 65 years of age.23 The age-adjusted, standardised death rate has fallen, but the absolute number of death caused by stroke still increases each year. China faces increasing challenges to reduce morbidity, mortality and disease burden from stroke in the coming years.
Risk factor control and continued investment in public health projects have helped reduce the stroke burden in the USA over the past 100 years.24 Conversely, risk factors are highly prevalent among patients with stroke in China; furthermore, the prevalence of major risk factors for stroke in the general population in China has increased from 2002 to 2012. For example, the age-standardised prevalence of being overweight among adults increased from 22.8% to 30.1%; the prevalence of obesity among adults increased from 7.1% to 11.9%; and the prevalence of hypertension increased from 18.6% to 25.2%. The Chinese government has implemented several public education and primary prevention initiatives for stroke, with some success. From 2002 to 2012, the awareness rate, treatment rate and control rate of hypertension improved by 16.3%, 16.4% and 7.7%, respectively. The daily salt intake by Chinese adults ≥18 years of age has decreased from 12.0 to 10.5 g during the same period, though this is still considered a high level.
The characteristics of in-patient stroke care from HQMS were comparable to previous reports based on the CNSR-II.4 25 Hypertension remains the leading risk factor for stroke, and pneumonia remains the leading comorbidity. In addition, the percentage of paediatric stroke, as well as the procedures and interventions for inpatient stroke care, was the first to be reported. With respect to the key performance indicators, 2018 data from CSCA indicated that the rate of anticoagulation for AF at discharge was almost doubled compared with the rate from CNSR-II in 2012–2013.
This report has several limitations. We used various sources of data, including but not limited to surveillance data, survey data, registry data and administrative data. These data vary in definition, form, quality and time of collection. Nevertheless, these are the best data available and have been carefully adjudicated. In addition, the representativeness of our data could not be guaranteed. For example, CSCA is based on hospitals’ voluntary enrolment and thus did not use a sampling process to obtain a nationally representative sample of hospitals. Only tertiary hospital data were used in HQMS. These data should be interpreted with caution, particularly at the province level.
This report summarised the most recent data on the characteristics, risk factors, admissions, geographical distribution, comorbidities, in-hospital management and outcomes for patients with all types of stroke in China. Information on inpatient care was based on the data from HQMS and CSCA in 2018. Compared with previous registry data, the contemporary HQMS data have a remarkable advantage in its scope and sample sizes. This report provides nationally representative and up-to-date evidence that will help guide the healthcare resource allocation and provide directions for future research in stroke care and prevention in China. Further efforts on comprehensive risk factor control for obesity and hypertension, as well as specific in-hospital management measure, including acute reperfusion treatment, anticoagulation for AF and prevention of pneumonia or pulmonary infection, are needed for stroke prevention and control.
Acknowledgments
We thank The National Health Commission of the People's Republic of China and China Standard Medical Information Research Center for the support of this study. We thank CSCA collaborating centers, members, and volunteers for their hard work and efforts. We thank every participant who has contributed important and invaluable data to CSCA.
References
Footnotes
Twitter @yilong
Y-JW, Z-XL, H-QG and YZ contributed equally.
Collaborators China Stroke Statistics 2019 Writing Committee (ordered alphabetically by First name): Beisha Tang (bstang7398@ 163. com, Department of Neurology, Xiangya Hospital, Central South University, Changsha, China), Caiyun Wang (wangcaiyun@chinastroke.net,Beijing Tiantan Hospital, Capital Medical University, Beijing, China), Chen Wang (wangchen-tr2002@163.com, Beijing Tiantan Hospital, Capital Medical University, Beijing, China), Bo Hu (hubo@ hust. edu. cn, Department of Neurology, Union Hospital, Tongji Medical College, Huazhong University of Science and Technology (HUST), Wuhan, China), Chang Yin (yinchang@niha.org.cn, Dept. of Healthcare Quality Monitoring and Control Research; National Institute of Hospital Administration, NHC; Beijing, China), Chuan-Qiang Pu(david.wang@chinastroke.net, Neurovascular Division, Department of Neurology, Barrow Neurological Institute, St. Joseph's Hospital and Medical Center, Phoenix, AZ 85013 USA), Dong-Shen Fan (dsfan@sina.com, Peking University Third Hospital), Dong Zhou (zhoudong66@yahoo.de, Department of Neurology, Huaxi Hoappital of Sichuan University), Gang Zhao (zhaogang@fmmu.edu.cn, Department of Neurology, Xijing Hospital, The 4th Military Medical University, Xi’an, China), Hai-Bo Wang (Haibo@mail.harvard.edu, Clinical Trial Unit, First Affiliated Hospital of Sun Yat-Sen University), Hao Wang (Department of Neurosurgery, Beijing Tiantan Hospital, Capital Medical University, Beijing, China), Jing Wu (wujing@chinacdc.cn, National Center for Chronic and Non-communicable Disease Control and Prevention, Chinese Center for Disease Control and Prevention), Jin-Sheng Zeng (zengjs@pub.guangzhou.gd.cn, The First Affiliated Hospital of Zhongshan University), Lan-Xia Gan (lanxia.gan@cltr.org, China Standard Medical Information Research Center, Shenzhen, China), Li Guo (guoli6@163.com, Department of Neurology, The Second Hospital of Hebei Medical University, Shijiazhuang, China), Li-Min Wang (wanglimin@ncncd.chinacdc.cn, National Center for Chronic and Non-communicable Disease Control and Prevention, Chinese Center for Disease Control and Prevention), Lin-Hong Wang (linhong@chinawch.org.cn, National Center for Chronic and Non-communicable Disease Control and Prevention, Chinese Center for Disease Control and Prevention), Li-Ying Cui (pumchcuily@sina.com, Peking Union Medical College Hospital), Mei-Jia Zhu (zhumeijia1818@163.com, Shandong Hospital of Thousand Buddha Mountain Affiliated to Shandong University), Ming Lou (loumingxc@vip.sina.com, Department of Neurology, The Second Affiliated Hospital of Zhejiang University School of Medicine), Ning Wang (nwang900@yahoo.com, Department of Neurology and Institute of Neurology, First Affiliated Hospital of Fujian Medical University, Fuzhou, China), Peng Xie (xiepeng@cqmu.edu.cn, Chongqing Medical University, Chongqing, China), Shuo Wang (captain9858@vip.sina.com, Department of Neurosurgery, Beijing Tiantan Hospital, Capital Medical University, Beijing, China), Tao Feng (happyft@sina.com, Department of Neurology, Beijing Tiantan Hospital, Capital Medical University, Beijing, China), Tong Zhang (zt61611@sohu.com, Capital Medical University School of Rehabilitation Medicine, China Rehabilitation Research Center, Beijing, China), Wen-Hua Zhao (zhaowh@chinacdc.cn, National Institute for Nutrition and Health, Chinese Center for Disease Control and Prevention), Xu-Dong Ma (13910092912@163.com, National Health Commission of The People's Republic of China), Xun-Ming Ji (robertjixm@hotmail.com/jixunming@vip.163.com, Department of Neurosurgery, Xuanwu Hospital, Capital University of Medicine, Beijing, China), Yi-Ming Deng (parkerdeng@163.com, Department of Interventional Neuroradiology, Beijing Tiantan Hospital, Capital Medical University), Yi Yang (doctoryangyi@163.com/doctor_yangyi@hotmail.com, Department of Neurology, the First Hospital of Jilin University, Changchun, China), Ying Shi (ying.shi@cltr.org, China Standard Medical Information Research Center, Shenzhen, China), Yu-Ming Xu (13903711125@126.com/xym13903711125@126.com, Department of Neurology, the First Affiliated Hospital of Zhengzhou University, Zhengzhou, China), Yu-Ping Wang (wangyuping01@sina.cn, Xuanwu Hospital of Capital Medical University), Zhong-Rong Miao (zhongrongm@163.com, Department of Interventional Neuroradiology, Beijing Tiantan Hospital, Capital Medical University, Beijing, China), Xiao-Yuan Niu (niuxiaoyuan1958@163.com, Department of Neurology, First Hospital of Shanxi Medical University, Taiyuan, China).
Contributors Y-JW, Z-XL, H-QG and YZ contributed equally to this work. J-ZZ, Y-JW, A-DX, QD and DW designed the protocol and framework and also participated in the revision. YZ, YJ, HL and JW drafted the sections of stroke-related risk factors. H-QG, X-QZ, Y-LW, L-PL and Z-XL drafted the section of stroke care quality and revised the whole manuscript. H-QG performed the statistical analysis based on data from the Hospital Quality Monitoring System and Chinese Stroke Center Alliance project. XY, XM, JJ and C-JW collected the data of stroke care quality.
Funding This study was funded by Ministry of Science and Technology of the People’s Republic of China, National Key R&D Programme of China (2017YFC1310901, 2016YFC0901002, 2017YFC1307905,and 2015BAI12B00), the Youth Programme (QML20180501), National Natural Science Foundation of China (81801152) and Beijing Talents Project (2018000021223ZK03 and 2018A13).
Map disclaimer The depiction of boundaries on this map does not imply the expression of any opinion whatsoever on the part of BMJ (or any member of its group) concerning the legal status of any country, territory, jurisdiction or area or of its authorities. This map is provided without any warranty of any kind, either express or implied.
Competing interests All authors declared that they have no financial and personal relationships with other people or organizations that can inappropriately influence their works.
Patient consent for publication Not required.
Provenance and peer review Commissioned; externally peer reviewed.