Article Text

Abstract
Objective To explore the additive effect of neurodegenerative diseases, measured by atrophy, on neurocognitive function in Asian dementia-free elderly with cerebrovascular disease (CeVD).
Methods The present study employed a cross-sectional design and was conducted between 2010 and 2015 among community-dwelling elderly participants recruited into the study. Eligible participants were evaluated with an extensive neuropsychological battery and neuroimaging. The weighted CeVD burden scale comprising markers of both small- and large-vessel diseases was applied, with a score of ≥2, indicating significant CeVD burden. Cortical atrophy (CA) and medial temporal atrophy (MTA) were graded using the global cortical atrophy scale and Schelten’s scale, respectively. Global and domain-specific (attention, executive function, language, visuomotor speed, visuoconstruction, visual memory, and verbal memory) neurocognitive performance was measured using a locally validated neuropsychological battery (Vascular Dementia Battery, VDB).
Results A total of 819 dementia-free participants were included in the analysis. Among none-mild CeVD subjects, there was no significant difference in the global cognitive performance across atrophy groups (no atrophy, CA, and CA+MTA). However, in moderate-severe CeVD subjects, CA+MTA showed significantly worse global cognitive performance compared with those with CA alone (mean difference=−0.35, 95% CI −0.60 to −0.11, p=0.002) and those without atrophy (mean difference=−0.46, 95% CI −0.74 to −0.19, p<0.001, p<0.001). In domain-specific cognitive performance, subjects with CA+MTA performed worse than other groups in visual memory (p=0.005), executive function (p=0.001) and visuomotor speed (p<0.001) in moderate-severe CeVD but not in none-mild CeVD.
Conclusions and relevance Atrophy and moderate-severe CeVD burden showed an additive effect on global and domain-specific cognitive performance. This study highlights the importance of investigating the mechanisms of clinico-pathological interactions between neurodegenerative processes and vascular damage, particularly in the pre-dementia stage.
- cerebrovascular disease
- atrophy
- cognition
- dementia
This is an open access article distributed in accordance with the Creative Commons Attribution Non Commercial (CC BY-NC 4.0) license, which permits others to distribute, remix, adapt, build upon this work non-commercially, and license their derivative works on different terms, provided the original work is properly cited, appropriate credit is given, any changes made indicated, and the use is non-commercial. See: http://creativecommons.org/licenses/by-nc/4.0/.
Statistics from Altmetric.com
Introduction
Brain atrophy is a neuroimaging marker of neurodegeneration caused by Alzheimer’s disease (AD),1 2 whereas cerebrovascular disease (CeVD) is considered the main contributor to vascular-related cognitive impairment (CI). The independent effect of atrophy and CeVD on cognition has been found in dementia patients,3 suggesting that atrophy and CeVD may contribute via differing mechanisms to CI.
Although atrophy is not commonly considered a typical CeVD marker, its association with brain CeVD severity is acknowledged.4–6 Atrophy and CeVD have been widely reported among elderly dementia patients, emphasising the overlapping pathology of AD and vascular dementia.7–9 In autopsy studies, the presence of CeVD, such as microinfarcts, shows an additive effect to AD pathology in increasing the odds of developing dementia and CI.10 Moreover, a recent imaging study on patients attending clinics in tertiary centres has shown that higher amyloid burden contributes to further deterioration in cognition, interactively with more severe CeVD.11 However, the additive effect of atrophy and CeVD on cognitive function has been mainly focused on dementia populations and has not been examined in a dementia-free elderly cohort.
A novel approach was recently developed for quantifying global CeVD burden that includes both small- and large-vessel disease. The simplified 4-point global CeVD burden scale was constructed and validated, and a threshold effect of global CeVD burden on cognition was found.12 13 Hence, the present study sought to explore in an Asian dementia-free elderly population if there was an additive joint effect of atrophy above and beyond CeVD on cognition.
Methods
Study population
The Epidemiology of Dementia In Singapore (EDIS) study drew participants from the Singapore Epidemiology of Eye Disease study, a multi-ethnic population-based study. An age-stratified (40–85 years) random sampling method was used to establish the study population with adequate representation of each ethnic group, that is, Chinese (Singapore Chinese Eye Study), Malay (Singapore Malay Eye Study) and Indian (Singapore Indian Eye Study). In the first phase of the EDIS study, participants aged ≥60 years (n=3800) were screened using the Abbreviated Mental Test and a self-report of progressive forgetfulness. Screen-positive subjects (n=1598) were invited to take part in the second phase of this study, which included a clinical evaluation, an extensive, locally validated neuropsychological test battery (the vascular dementia battery, VDB)14 15 and brain MRI. Out of these 1598 participants, 957 agreed to participate in phase II and hence were included in the present study, among whom 911 were dementia-free elderly. The study recruitment period was from 8 December 2010 to 24 July 2015. Subjects who refused to participate in phase II were older, had lower education and socioeconomic status, higher blood pressures and lower cholesterol levels.16 Details of the EDIS study methodology have been described elsewhere.17 Ethical approval was obtained from the National Healthcare Group Domain-Specific Review Board. Written informed consent was obtained in the preferred language of the participants.
Vascular risk profile
A vascular risk profile was recorded for all study participants, which included the following: (1) hypertension, defined as a previous diagnosis of hypertension, the use of antihypertensive medication, or a systolic blood pressure ≥140 mmHg and/or diastolic blood pressure ≥90 mmHg on clinical assessment; (2) hyperlipidemia, defined as a previous diagnosis of hyperlipidemia, the use of lipid-lowering medication or total cholesterol levels≥4.14 mmol/L; (3) diabetes mellitus, defined as a previous diagnosis of diabetes mellitus, the use of glucose-lowering medication or glycated haemoglobin ≥6.5%; (4) ischaemic heart disease, defined as a previous diagnosis of the following—myocardial infarction, congestive heart failure, atrial fibrillation, coronary angioplasty or stenting; (5) self-reported history of smoking; and (6) documented history of stroke.
Neuroimaging protocol
MRI scans were performed on a 3T Siemens Magnetom Trio Tim scanner, using a 32-channel head coil. Several MRI brain sequences were performed to allow morphological and microstructure assessments, including T1-weighted, fluid attenuated inversion recovery, T2-weighted and susceptibility-weighted imaging.
MRI markers of CeVD were graded following the previously described procedures:12 13
Cortical infarcts were defined as focal lesions involving cortical grey matter, signal following cerebrospinal fluid intensity, hyperintense rim on fluid-attenuated inversion recovery images and tissue loss of variable magnitude, with prominent adjacent sulci and ipsilateral ventricular enlargement.18
Intracranial stenosis (ICS) was defined as narrowing exceeding 50% of the luminal diameter in any of the intracranial vessels assessed on three-dimensional time-of-flight magnetic resonance angiography. The images were first visually assessed on the reconstructed images, and the final decision on stenosis (>50%) was made on the source images.
Lacunes were defined as lesions, 3–15 mm in diameter, with a low signal on T1-weighted image and fluid attenuated inversion recovery, a high signal on T2-weighted image and a hyperintense rim with a centre following cerebrospinal fluid intensity on fluid-attenuated inversion recovery.19
White matter hyperintensities (WMH) were graded using the Modified Fazekas Scale.20
Cerebral microbleeds were defined on susceptibility-weighted imaging sequences using the Brain Observer Microbleed Scale.21
MRI markers of CeVD were transformed into binary variables and recorded as the presence/absence of multiple lacunar infarcts, multiple microbleeds, cortical infarcts, ICS and moderate-severe severity of WMH on the Fazekas scale. The weighted CeVD burden scale,12 which was established based on the strength of independent association between CeVD markers and global neurocognitive performance, was applied in the present study to indicate global CeVD burden severity (none-very mild [0], mild [1], moderate [2] and severe [3]). Significant CeVD was defined by a score of 2 and above; hence, two CeVD groups were obtained: (1) none-mild; (2) moderate-severe (refer to online supplementary material for details of the scale).
Supplemental material
Cortical atrophy (CA) was graded on the Global Cortical Atrophy Scale,22 and medial temporal atrophy (MTA) was graded on the Scheltens Scale.23 The presence of significant CA or MTA was defined by a score of ≥3 on either scale.
Subsequently, three atrophy groups were classified according to CA and MTA grading: (1) no atrophy, as defined by the absence of significant atrophy (CA and MTA); (2) CA, as defined by the presence of significant CA and the absence of MTA and (3) CA+MTA, as defined by the presence of significant CA and MTA.
Neuropsychological assessment
The VDB measures the following domains: (1) attention (digit span test, visual span test and auditory detection test); (2) language (15-item modified Boston Naming Test and category fluency); (3) visuoconstruction (visual reproduction subtest of the Weschler Memory Scale-Revised copy task, clock drawing and the block design subtest of the Weschler Adult Intelligence Scale-Revised); (4) visuomotor speed (digit cancellation, maze and symbol digit modalities); (5) verbal memory (word list recall and story recall); (6) visual memory (picture recall and the visual reproduction subtest of the Weschler Memory Scale-Revised) and (7) executive function (frontal assessment battery). All individual tests on the VDB are widely used tests and are adapted to the local population.24
Cognitive impairment status
Weekly research consensus meetings were held among clinicians, psychologists and research personnel. Details from the clinical assessment, blood investigations, neuropsychological testing and MRI scans were reviewed. The diagnosis of no cognitive impairment was given to participants who had neither objective CI on formal neuropsychological tests nor functional loss. The diagnosis of cognitive impairment-no dementia (CIND) was given to participants who had impairment on at least one cognitive domain on the VDB without functional loss, and therefore did not meet the criteria for dementia. CIND was further classified into CIND-mild (impairment in one or two domains on the VDB) and CIND-moderate (impairment in three or more domains on the VDB). Details of diagnostic criteria have been described elsewhere.16 24
Statistical analysis
Raw scores for all individual cognitive tests on the VDB were transformed to standardised z-scores using the means and SDs of the entire sample. The z-score for each domain was created by averaging the z-scores of individual tests and standardised using the means and SDs of the entire sample. To obtain the global cognitive z-score for each patient, the domain z-scores were averaged and standardised using the means and SDs of the entire sample.
The additive effect of CeVD and atrophy was measured by comparing across three atrophy groups (no atrophy, CA, and CA+MTA), stratified by CeVD burden severity. Sensitivity analysis was performed by modelling cases with incomplete MRI investigation. In model 1, any individual who had missing values for CeVD and atrophy severity was assigned to ‘moderate-severe CeVD and CA+MTA’ group; in model 2, any individual who had missing values for CeVD and atrophy severity was assigned to ‘none-mild CeVD and no atrophy’ group. All analyses were controlled for covariates such as age, education, gender, CI status, presence of hypertension, hyperlipidemia, diabetes, ischaemic heart disease, smoking history and history of stroke. All analyses were performed using standard statistical software (Statistical Package for Social Science (SPSS) V.24; SPSS, Inc.) and a p value of<0.05 (two-sided) was used to indicate significance. Bonferroni correction was performed to obtain adjusted significance level for individual domain-specific cognitive test: ≈0.05/7≈0.007.
Results
Out of the 911 participants recruited into the study, 92 did not complete MRI scans or had MRI scans that could not be graded, leaving a total of 819 participants included in this analysis. There was no significant difference between participants who were included in and excluded from the analysis. Table 1 shows the characteristics of study participants.
Characteristics of the study population
A total of 520 participants had none-mild CeVD burden, among whom 362 (69.6%) had neither significant CA nor MTA, 133 (25.6%) had CA only and 25 (4.8%) had CA+MTA. Out of the 299 participants with moderate-severe burden of CeVD, there was more atrophy: 109 (36.5%) had neither significant CA nor MTA, 132 (44.1%) had CA and 58 (19.4%) had CA+MTA (χ2=96.4, p<0.001). There were no subjects with MTA alone.
In the whole sample, there was a significant difference in the global cognitive z-score across the three atrophy groups (0.26±0.87, –0.08±0.82 and −0.51±0.77, respectively, p<0.001), after controlling for age, gender, education, CI status and the presence of vascular risk factors.
Additive effect of CeVD and atrophy
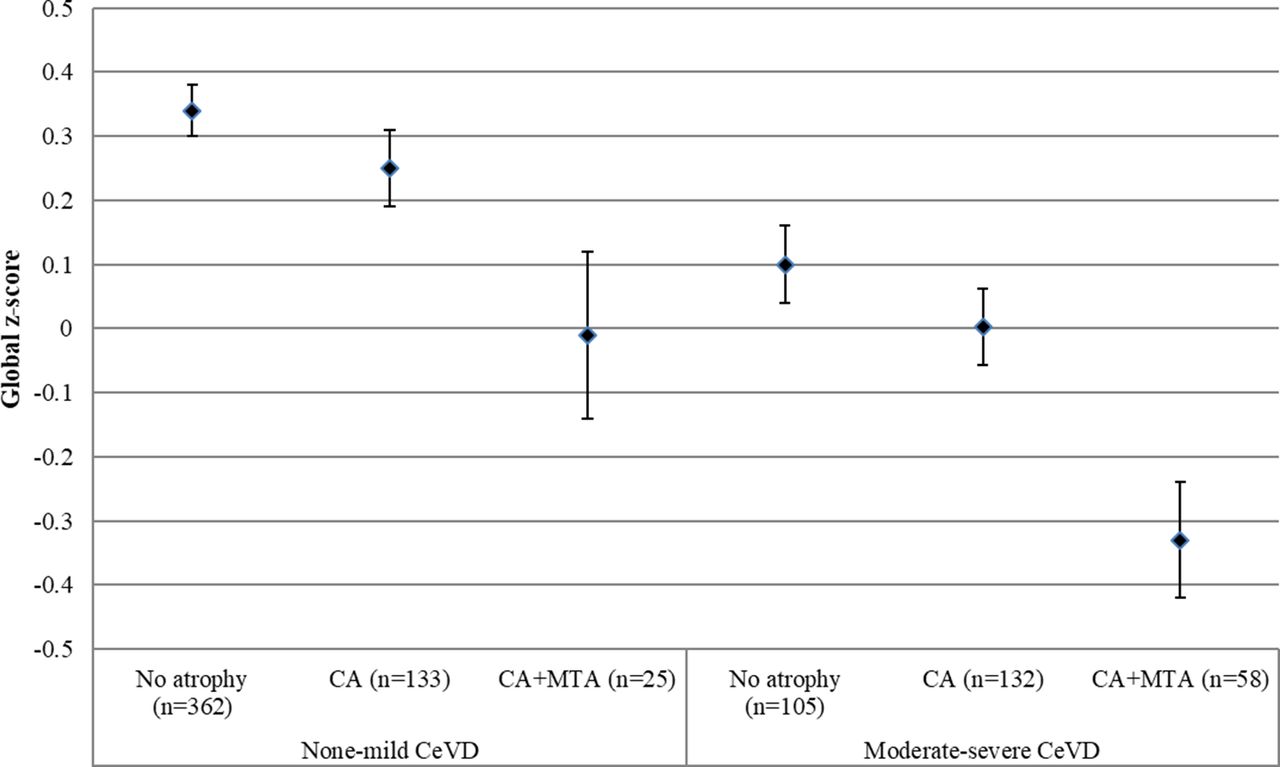
Further Analysis of Variance (ANOVA) models were conducted, which showed that in the none-mild CeVD group, there was no significant difference in scores between all three atrophy groups in global cognition. In subjects with significant CeVD, the CA+MTA group performed significantly worse than the no atrophy group (mean difference=−0.46, 95% CI −0.74 to −0.19, p<0.001) and CA group (mean difference=−0.35, 95% CI −0.60 to −0.11, p=0.002) (figure 1), after controlling for age, gender, education, CI status and the presence of vascular risk factors.
Global cognitive z-score in different atrophy groups stratified by CeVD burden severity. Values are mean (SE). No atrophy, defined by the absence of significant atrophy (CA and MTA); CA, defined by the presence of significant CA and the absence of MTA; CA+MTA, defined by the presence of significant CA and MTA. CA, cortical atrophy; CeVD, cerebrovascular disease; MTA, medial temporal atrophy.
In domain-specific cognitive performance, there was no significant difference between atrophy groups in subjects with none-mild levels of CeVD. However, in the moderate-severe CeVD group, subjects with CA+MTA had worse deficits in executive function (p=0.001), visual memory (p=0.005) and visuomotor speed (p<0.001) domains compared with those with no atrophy or CA only (table 2).
Domain-specific cognitive z-scores in no atrophy, CA and CA+MTA groups in different CeVD groups
Notably, there was no significant difference in the global cognitive z-score for non-significant and significant CeVD groups among subjects with CA+MTA (F(82)=0.80, p=0.37), after controlling for covariates. This reflects a unidirectional additive effect of atrophy (CA+MTA) on top of CeVD, but not vice versa.
Sensitivity analysis
Missing data were imputed in two models. In model 1, all subjects with missing MRI data were assigned with moderate-severe CeVD and CA+MTA. ANOVA conducted showed that in subjects with none-mild CeVD, the CA+MTA group performed significantly worse than the no atrophy group (mean difference=−0.32, 95% CI −0.65 to −0.003, p=0.04). In subjects with moderate-severe CeVD, there was no significant difference across the three atrophy groups.
In model 2, all subjects with missing MRI data were assigned with none-mild CeVD and no atrophy. ANOVA analysis showed that while no significant difference across atrophy groups was seen in none-mild CeVD group, CA+MTA groups demonstrated more significant global cognitive deficit than those with no atrophy (mean difference=−0.46, 95% CI −0.74 to −0.19, p<0.001) and those with CA only (mean difference=−0.35, 95% CI −0.60 to −0.11, p=0.002).
Discussion
The main finding of the current study is that in an elderly dementia-free population in Asia, among subjects with none-mild CeVD burden, the presence of CA and MTA did not show significant adverse effect on cognitive function, while in those with a moderate-severe level of CeVD burden, the presence of significant CA+MTA further worsened global cognitive function compared with those with CA only, with predominant impairment in specific cognitive domains such as visual memory, executive function and visuomotor speed.
With the growing awareness of the coexistence of AD pathology and CeVD, there have been reports that dementia patients with signs of CeVD also have a concomitant neurodegenerative disease and that dementia patients with dual pathologies have more impaired cognitive functions compared with those with purely AD pathology.25 26 To complement previous studies, we report that even in a dementia-free population, subjects with both CeVD and atrophy, especially atrophy in multiple brain regions, demonstrated further reduction in cognitive function, reflecting the additive effects of both neurodegenerative processes and CeVD.
Previously, decreased MTA volume was found to be associated with poor memory performance with a particular effect on visual memory.27 However CA was not taken into consideration in the study; hence, its role in affecting cognition, especially visual memory function, was not investigated. In the present study, the addition of MTA to CA further worsened the visual memory function. This suggests that MTA contributes significantly to dysfunction visual memory not only independently, but also additively to the presence of significant CA. However, this additive effect was only seen in subjects with significant CeVD and not in those with mild or no CeVD. The threshold effect of CeVD on visual memory has been previously reported,13 highlighting the importance of investigating CeVD markers in addition to markers of neurodegeneration. Our results provide further emphasis on the crucial need of investigating the cumulative and synergistic effect of brain structural abnormalities on neurocognitive function.
While it is believed that CeVD could result in disruptions of cortico–cortico connections leading to impaired executive function and reduced processing speed, some studies suggest that these lesions may potentially exacerbate CA.28 Animal studies have suggested that vascular dsyfunction may trigger amyloid production through increased oxidative stress or neuroinflammative responses.29 However, the underlying mechanism in the interaction between CeVD and neurodegeneration remains inconclusive and further prospective neuropathological studies are required to elucidate the directional associations between vascular and AD pathologies.
The present study has weaknesses and strengths. The main limitation is that only screen-positive subjects in phase I were included in phase II of the study. As has been stated previously, subjects who refused to participate in phase II were older, had lower education and socioeconomic status, higher blood pressures and lower cholesterol levels.16 This may have led to an underestimation of the prevalence of CeVD in the present study.13 It also affects the generalizability of study results to the whole study population; however, sensitivity analyses showed that the primary results were robust. In addition, there is no subject with only MTA but not CA. This disallows comparison between the two different patterns of atrophy. Other limitations of this study include the lack of control for possible medications or treatments taken by the subjects and the lack of other supportive AD biomarkers such as amyloid burden. The main strengths of our study include the large sample size, a community-based study population and the inclusion of multiple CeVD markers which provided an integrated measurement of global brain structural abnormalities. A further strength was the use of a comprehensive neuropsychological battery, which was able to generate both global and domain-specific cognitive indexes.
Conclusions
We found that the presence of atrophy, especially MTA, in addition to moderate-severe global CeVD burden further worsens cognitive dysfunction in a dementia-free elderly population. Our findings suggest that there is a threshold effect of CeVD burden at which the neurodegenerative disease begins to demonstrate significant additive effect, even at preclinical stages of dementia. Further studies in other populations are needed to replicate these findings and to investigate the mechanisms for this clinico-pathological interaction.
References
Footnotes
Contributors XX was responsible for study concept and design, acquisition of data, analysis and interpretation of data, and critical revision of the manuscript. AKSP and SH were responsible for acquisition of data and critical revision of the manuscript for intellectual content. SLC and MKI were responsible for critical revision of the manuscript for intellectual content. TYW, CYC and NV were responsible for study design and critical revision of the manuscript for intellectual content. CLHC was responsible for study concept and design, supervision of analysis and interpretation of data, and critical revision of the manuscript for intellectual content.
Funding The Epidemiology of Dementia in Singapore study is supported by the NMRC Centre Grant - Memory Aging and Cognition Centre (MACC) - Theme 5 (NMRC/CG/NUHS/2010 - R-184-006-184-511); NUHS Bridging Fund (NUHSRO/2013/114/5+5 budget/01); NMRC Clinician Scientist Award (NMRC/CSA/038/2013); and NMRC Centre Grant - NUHS - Metabolic Medicine, Infectious Diseases, Neuroscience Enablers (MINE) (NMRC/CG/013/2013). The National University Hospital assisted in study participant recruitment. Research assistants and coordinators (Memory, Ageing and Cognition Centre) contributed to study participant recruitment and assessment.
Competing interests None declared.
Provenance and peer review Not commissioned; externally peer reviewed.
Patient consent for publication Not required.