Article Text

Abstract
Objectives Endovascular treatment strategies to optimise individualised care for patients with vertebral artery (VA) stenosis need to be revisited. This study aimed to investigate the relationship between net VA flow volume (NVAFV) and the risk of posterior circulation infarction (PCI) in a high-risk patient population.
Methods We screened 1239 patients with extracranial VA stenosis, of whom 321 patients with severe VA V1 segment stenosis (≥70%) were enrolled in our study. We restratified the patients based on NVAFV and contralateral VA stenosis grades to analyse the proportion of each PCI mechanism—large artery atherosclerosis and branch artery occlusive disease. Furthermore, we estimated the incidence of recurrent ischaemic stroke between groups with different NVAFV over a follow-up period of 2 years.
Results NVAFV was lower in the PCI group. Multiple logistic regression analysis showed that NVAFV is an independent risk factor for PCI and that the OR for PCI for the lowest NVAFV (<112.8 mL/min) was 4.19 (1.76 to 9.95, p=0.001). In patients with severe carotid artery disease, the OR for the lowest NVAFV was 14.03 (3.18 to 61.92, p<0.001). The lower NVAFV group had a higher incidence of recurrent ischaemic stroke events than the higher NVAFV group (HR 2.978, 95% CIs 1.414 to 6.272).
Conclusion Our study demonstrated that NVAFV, as estimated by colour duplex ultrasonography, was associated with the incidence of PCI and subsequent ischaemic events and that a high-risk population could be identified for further posterior circulation revascularisation.
- stroke
- ultrasonography
- ischemic attack
- transient
Data availability statement
Data are available upon reasonable request. Not applicable.
This is an open access article distributed in accordance with the Creative Commons Attribution Non Commercial (CC BY-NC 4.0) license, which permits others to distribute, remix, adapt, build upon this work non-commercially, and license their derivative works on different terms, provided the original work is properly cited, appropriate credit is given, any changes made indicated, and the use is non-commercial. See: http://creativecommons.org/licenses/by-nc/4.0/.
Statistics from Altmetric.com
Introduction
Approximately one-fifth of all ischaemic strokes occur in the posterior circulation system, and steno-occlusive disease of the vertebrobasilar arteries is an important underlying pathophysiological mechanism responsible for approximately one-quarter of these ischaemic stroke cases.1 Emerging data have suggested that vertebrobasilar stenosis predicts recurrent ischaemic events whose average annual incidence rate is 10%–15%.2 3 Therefore, effective secondary prevention strategies are important.
Endovascular treatment (EVT) of vertebral artery (VA) stenosis with the use of stents is a promising option and is widely implemented in clinical practice.4 5 However, both the Vertebral Artery Stenting Trial (VAST)6 7 and the Vertebral Artery Ischemia Stenting Trial (VIST)8 9 have failed to demonstrate the superiority of stenting in preventing recurrent strokes in patients with symptomatic VA stenosis compared with optimal medical management. Based on data from the above trials, many experts have suggested that the current treatment strategies should be revised to provide optimal individualised care for all patients. Many issues need to be discussed before deciding to perform revascularisation, even in patients with severe VA stenosis. Considering the periprocedural risks associated with endovascular therapy, angioplasty and stenting are more likely to benefit specific groups of patients with the highest risk of ischaemic events.
It is now recognised that haemodynamic insufficiency plays an important role in the aetiology of stroke associated with VA stenosis.10 Colour duplex ultrasonography (CDU) is a dynamic real-time tool for the quantitative measurement of blood flow velocities and volumes.11–13 Given that EVT does not significantly benefit patients with symptomatic VA stenosis and the need for revising current treatment strategies for individualised patient care, this study aimed to investigate the relationship between net VA flow volume (NVAFV) and the risk of posterior circulation infarction (PCI) to find the high-risk patient population who could benefit from revascularisation.
Methods
Patients
From January 2018 to January 2019, we enrolled patients who were diagnosed with severe VA V1 segment stenosis (≥70%) based on vascular ultrasound findings that were further verified with CT angiography (CTA) or digital subtraction angiography (DSA). We retrieved additional data from patient history and laboratory tests during hospitalisation. Clinical information about age, sex, hypertension, diabetes mellitus, dyslipidaemia, smoking history, coronary heart disease history and medical history (including antiplatelet count and statin drug use) was collected from medical records. Laboratory test data for glucose, cholesterol, high-density lipoprotein and low-density lipoprotein levels were collected simultaneously. Two radiologists reviewed the MRI findings and located lesions, and more than two neurologists ascertained the presence of acute ischaemic stroke by combining clinical data and brain MRI findings. By conventional definition, transient ischaemic stroke (TIA) was defined as the occurrence of focal neurological symptoms and signs lasting for <24 hours.14 The presumed aetiology of stroke, which was deduced by the anatomic location and distribution of infarcts on brain MRI, was categorised into two types—large artery atherosclerosis (LAA) and branch artery occlusive disease (Br A)—based on the independent determination of the two neurologists.
Inclusion criteria
(1) Diagnosis of severe unilateral or bilateral VA V1 segment stenosis (≥70%), (2) vertebral blood flow volume quantification by CDU examination and (3) available clinical and laboratory data as well as MRI and CTA findings or DSA findings to confirm VA stenosis.
Exclusion criteria
(1) Definitive diagnosis of embolic infarction caused by atrial fibrillation or other cardiogenic diseases, (2) severe stenosis or occlusion of the intracranial vertebral or basilar arteries, (3) diagnosis of cerebral haemorrhage, encephalitis, posterior reversible encephalopathy syndrome, demyelinating disease or other non-vascular diseases and (4) diagnosis of vertebral dissection.
Criteria for 70–99% extracranial VA stenosis
CDU: according to the diagnostic criteria published previously by our research team,15 we defined 70%–99% stenosis of extracranial VA based on the following criteria: (1) peak systolic velocity (PSV) at the origin of the VA (PSV origin) ≥210 cm/s, (2) ratio of PSVorigin to the intervertebral VA segments ≥4.0 and (3) end-diastolic velocity at the origin ≥50 cm/s. All three criteria had to be satisfied (figure 1)
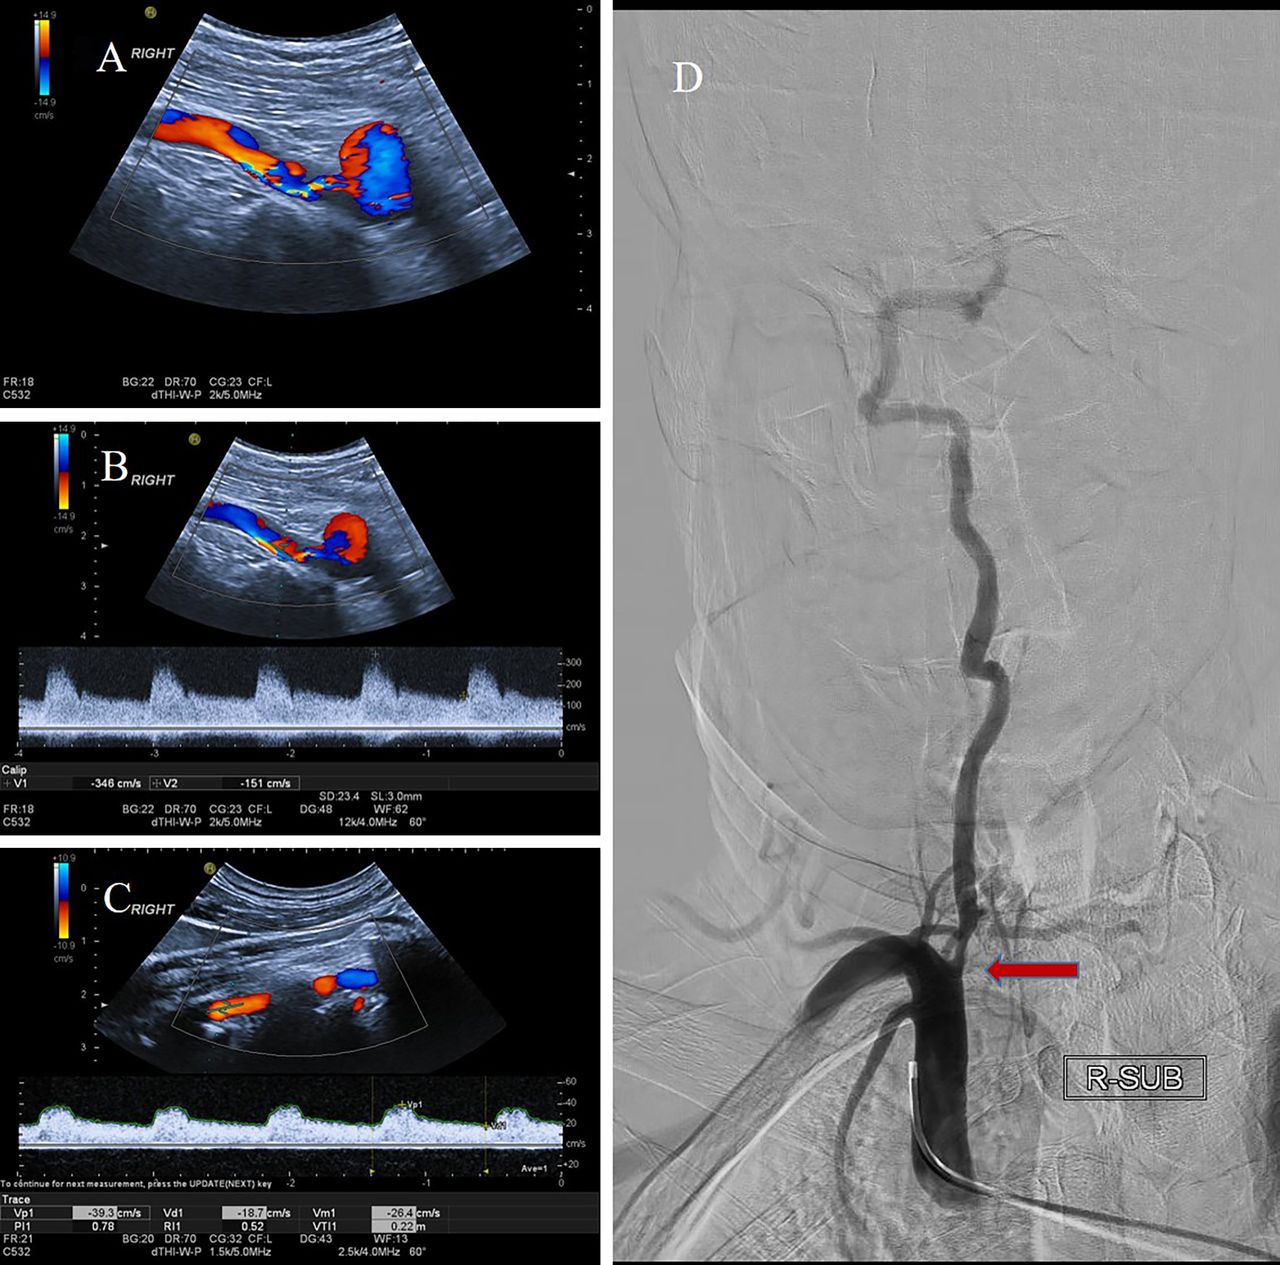
Patients with severe stenosis at V1 segment of right vertebral artery (RVA). (A) Colour Doppler image shows severe stenosis at V1 segment of RVA. (B) Spectral Doppler waveform shows high-velocity flow in V1 segment of RVA. (Peak systolic velocity: 346 cm/s; end-diastolic velocity:151 cm/s). (C) Spectral Doppler waveform shows stable flow in C3–C4 intervertebral segment of RVA. (Peak systolic velocity:39 cm/s; end-diastolic velocity:18 cm/s). (D) Digital subtraction angiogram shows severe stenosis at V1 segment of RVA.
CTA or DSA: according to the method of assessing carotid artery stenosis in the North American Symptomatic Carotid Endarterectomy Trial,16 the ratio between the residual luminal surface (inner-to-inner lumen) at the stenosis site and the surface of the distal normal lumen (inner-to-inner lumen), where there is no stenosis, was calculated. The degree of stenosis at the VA origin was stratified as <50%, 50%–69%, 70%–99% and occlusion. We only enrolled the patients with unilateral or bilateral VA V1 segment stenosis (≥70%) (figure 1).
CDU quantification of blood flow volume in the VA
Quantification of blood flow volume in the VA was performed by experienced sonographers with more than 5 years of experience using Philips EPIQ5 (Philips, Bothell, Washington) with 5.0–12.0-MHz linear transducers. All the patients underwent CDU examination. We recorded the lumen diameter, PSV and end-diastolic velocity of each segment of the VA. The V2 segment (C3–C5 vertebrae intertransverse segments) of the VA was used to calculate the VA blood flow volume by multiplying the time-averaged mean velocity with the cross area of the segment. NVAFV was calculated as the sum of the bilateral VA blood flow volumes.
PCI criteria
PCI was diagnosed based on the following two criteria: (1) diffusion-weighted imaging (DWI) positive for infarcts in the brainstem, cerebellum thalamus, medial temporal lobe and occipital regions supplied by the VA, basilar artery (BA) and posterior cerebellar artery (PCA) and (2) DWI negative with low signals on T1-weighted images and high signals on T2-weighted and fluid-attenuated inversion recovery images simultaneously in the brainstem, cerebellum thalamus, medial temporal lobe and occipital regions supplied by the VA, BA and PCA.
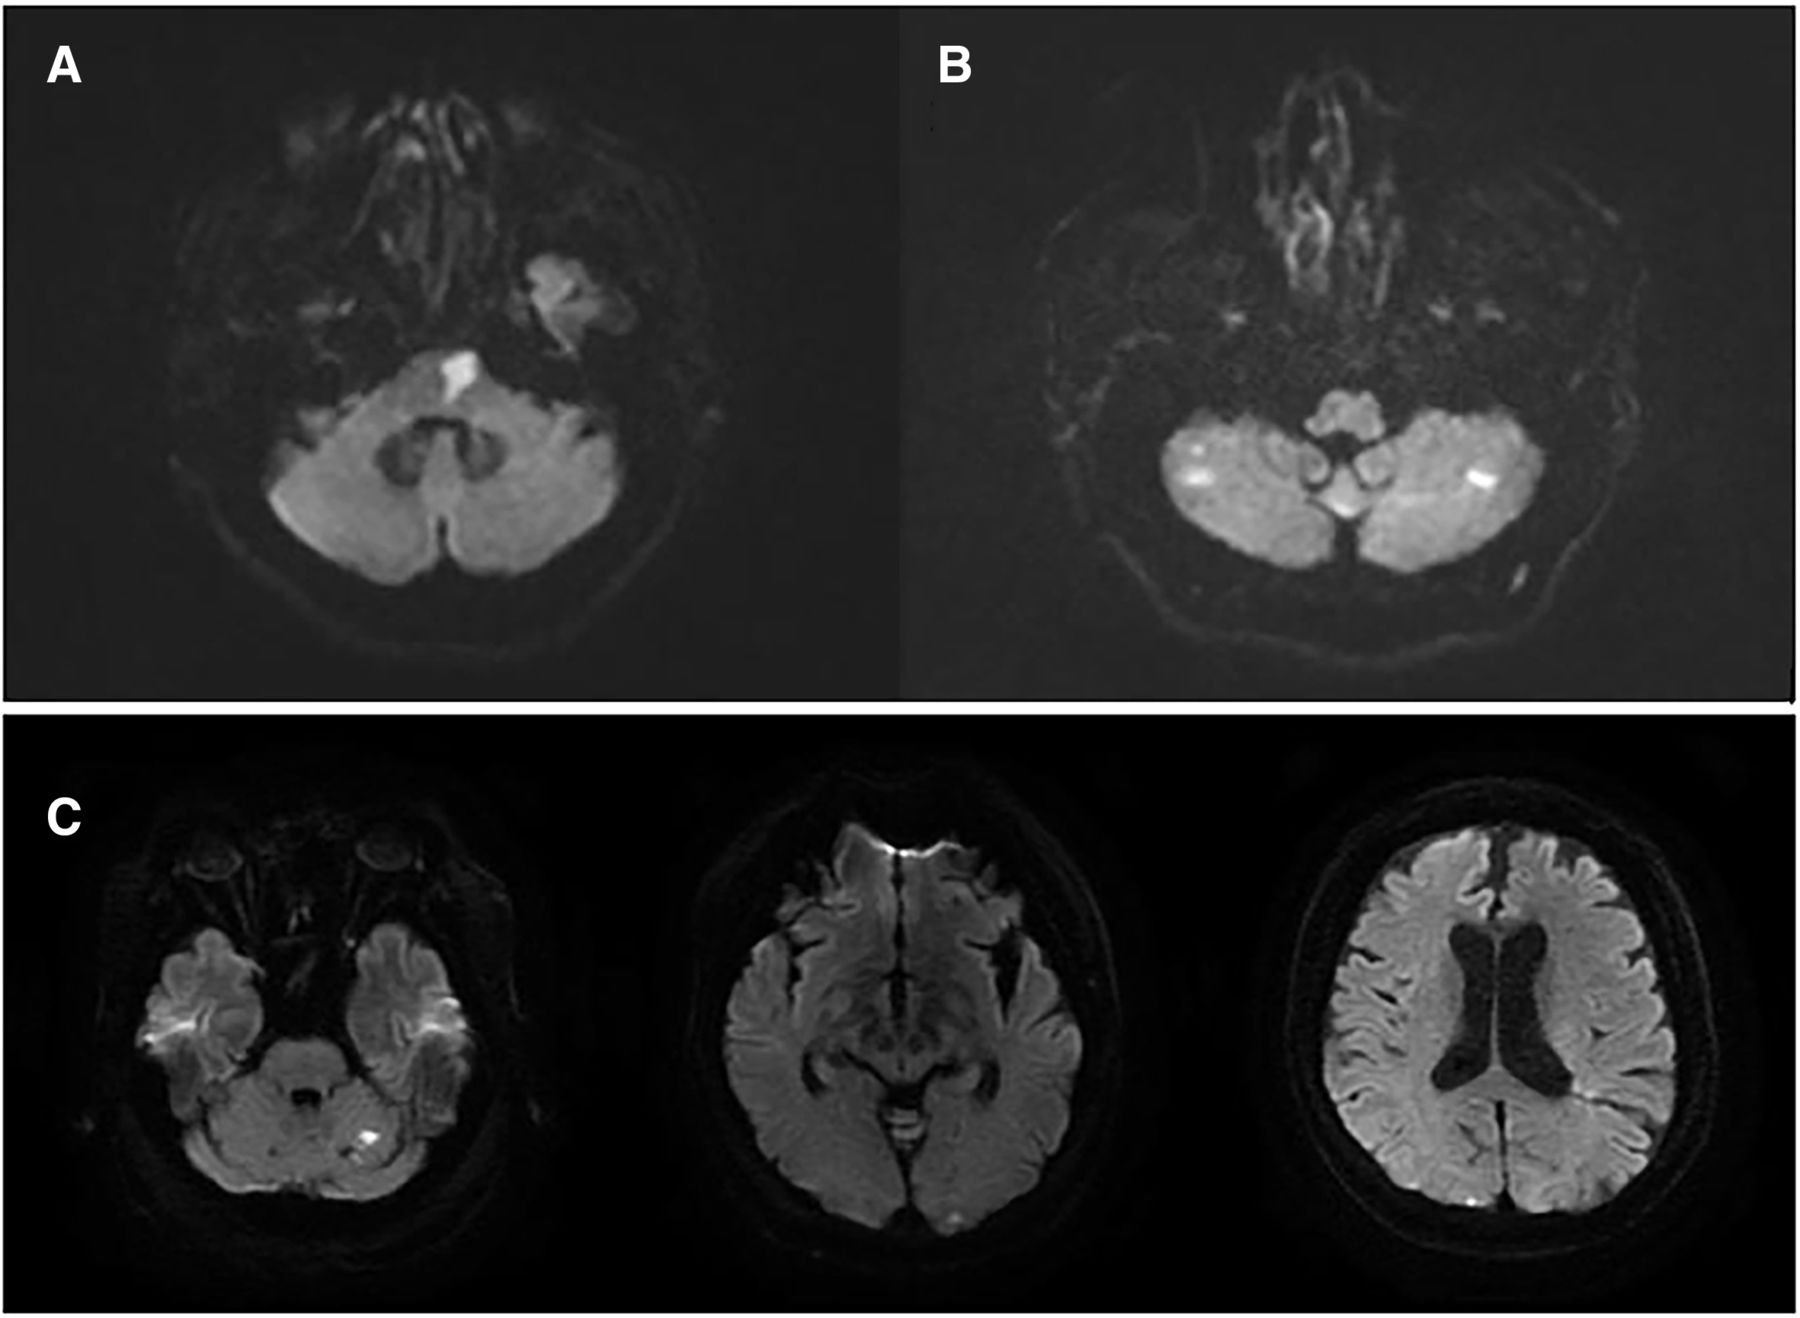
We categorised PCI mechanisms according to the classification criteria proposed by Caplan et al 10 17 and the TOAST (Trial of ORG 10172 in acute stroke treatment) classification18 as follows: (1) large artery occlusive disease haemodynamic mechanism (LAH), with MRI showing an ischaemic lesion located in the occlusion territory that is larger than a single-branch artery territory or that extends in distal fields, (2) Br A, with MRI showing infarcts limited to a single penetrating or circumferential branch territory and (3) artery-to-artery embolism (EmbA-A), with MRI showing multiple scattered infarcts in the territory of the main intracranial artery or the superficial branches in the posterior circulation area. We grouped LAH and EmbA-A into the LAA group (figure 2).

PCI mechanisms in patients with symptomatic vertebral artery stenosis. (A) A single lesion in the penetrating artery territory indicating Br A. (B) Multiple lesions in posterior circulation territories indicate LAH (large artery occlusive disease haemodynamic mechanism). (C) Multiple cortical infarctions indicating EmbA-A. Br A, branch artery occlusive disease; EmbA-A, artery-to-artery embolism; PCI, posterior circulation infarction.
Follow-up recurrent ischaemic events
After initial hospitalisation for an ischaemic event, we assessed the patients for subsequent ischaemic events over 2 years of follow-up. We defined an ischaemic stroke as recurrent only when a new clinical symptom was accompanied by a new lesion detected on MRI. The endpoint time was determined as the time for the first recurrent ischaemic event to occur.
Statistical analysis
Normally distributed continuous variables were expressed as mean±SD. Continuous variables with skewed distribution were expressed as medians (IQRs) and categorical variables were expressed as numbers (percentages). For equivalent variables with a normal distribution, independent Student’s t test was used to compare the PCI and non-PCI groups. The Mann-Whitney U test was used to compare categorical variables and abnormally distributed variables between these two groups. Receiver operating characteristic (ROC) analysis was performed to identify the cut-off value. Area under the curve, optimal threshold, sensitivity and specificity were calculated. Logistic regression analysis was performed to screen for independent risk factors after adjusting for all confounders, including traditional factors and parameters distributed differently in each group. Statistical significance was defined as a two-sided p value of <0.05. CIs were set at 95%. Kaplan-Meier analysis was used to compare the incidence of recurrent ischaemic events for groups with different NVAFV. Statistical analyses were performed using the IBM SPSS (V.22.0) and GraphPad Prism (V.6.01) software.
Results
A total of 1239 patients were diagnosed with extracranial VA stenosis at our department, and 822 patients were excluded because of extracranial non-severe VA stenosis or bilateral VA occlusion; another 86 patients were excluded because of severe intracranial vertebral or BA stenosis. The remaining 331 successive patients were reviewed, and 10 patients with no MRI findings were excluded. Finally, 321 participants with complete clinical information and CDU data were enrolled in our study. After 2 years, 262 (81.6%) patients completed follow-up. PCI was observed in 142 (44.2%) of the 321 patients, of which 94 (66.2%) were categorised into the LAA group and 48 (33.8%) into the Br A group; 54 (16.8%) patients with ischaemic symptoms were diagnosed with TIA due to no abnormal MRI signals in the posterior circulation area. Furthermore, 125 patients had either asymptomatic or anterior circulation infarction and were categorised into the non-PCI group.
Patient demographic characteristics and blood flow volume
Age and sex distributions were similar between the groups. The prevalence of hypertension, diabetes mellitus, coronary heart disease, dyslipidaemia, smoking history and medical history was not significantly different between the groups; the same was noted for glucose, cholesterol, high-density lipoprotein and low-density lipoprotein levels. The proportion of severe anterior circulation artery stenosis was higher in the non-PCI group than in the PCI group (62.4% vs 31.7%, p<0.001). Patients with severe contralateral VA stenosis were more likely to experience PCI (32.4% vs 8.8%, p<0.001). Both NVAFV and the flow volume in the severely stenotic side were lower in the PCI group than in the non-PCI group (76.4±46.6 vs 64.5±40.4, p=0.027; 182.8±70.2 vs 141.0±60.9, p<0.001, respectively), and this was also the case in the PCI +TIA group (76.4±46.6 vs 66.8±41.3, p=0.056; 182.8±70.2 vs 147.3±61.2, p<0.001, respectively). The detailed information is provided in table 1.
Patient demographic characteristics and flow volume in each group
Patient demographics in groups with different NVAFV
For classification, NVAFV was equally divided into four parts with values ranging from low to high. The clinical examination values and basic laboratory data were not significantly different among the groups with different NVAFV. The proportion of PCI was much higher in the lower NVAFV (L-NVAFV) group than in the higher NVAFV (H-NVAFV) group (65% vs 49.4% vs 36.2% vs 26.2%, p<0.001). This result was consistent in the PCI +TIA group (80% vs 60.5% vs 62.5% vs 41.2%, p<0.001). The mechanism of PCI exhibited a remarkably different distribution among the different NVAFV groups, and the prevalence of LAA was inversely correlated to the increase in NVAFV (51.2% vs 30.9% vs 23.8% vs 11.2%, p<0.001), whereas the prevalence of Br A was similar among these groups. NVAFV had increased in patients with severe anterior circulation artery stenosis. Patients with >70% contralateral VA stenosis accounted for 45% of patients in the L-NVAFV group and only 7.5% in the H-NVAFV group. A detailed description of this is provided in online supplemental table 1.
Supplemental material
Multiple logistic regression analysis of PCI and NVAFV
As shown in table 2, NVAFV was a significant predicting factor for PCI or PCI+TIA after adjusting for age, sex, contralateral VA stenosis and anterior severe stenosis. Compared with the highest NVAFV (>199.1 mL/min), the lowest NVAFV (<112.8 mL/min) had a profound effect on the prevalence of PCI and PCI+TIA (OR 4.19, 95% CI 1.76 to 9.95, p=0.001; OR 3.63, 95% CI 1.63 to 8.10, p=0.001). Contralateral VA stenosis of <70% had an effect on the prevalence of PCI or PCI+TIA, similar to VA hypoplasia; however, contralateral VA stenosis of >70% or occlusion had a higher tendency to result in PCI or PCI +TIA compared with hypoplasia and contralateral VA stenosis of <70% (OR 3.32, 95% CI 0.96 to 11.46, p=0.058; OR 3.23, 95% CI 0.98 to 10.65, p=0.055). We separated these patients into two groups based on the presence of severe stenosis (≥70%) in the anterior circulation artery. The lowest NVAFV had a predominant effect on the prevalence of PCI compared with the highest NVAFV in patients with severe stenosis of the anterior circulation arteries (OR 14.03, 95% CI 3.18 to 61.92, p<0.001). Contralateral VA stenosis of >70% or occlusion tended to induce PCI or PCI +TIA compared with contralateral VA hypoplasia or stenosis of <70% in patients without severe anterior circulation artery stenosis (OR 6.67, 95% CI 0.91 to 49.04, p=0.062; OR 6.80, 95% CI 0.98 to 47.13, p=0.052); however, this relationship was not found in patients with severe anterior circulation artery stenosis.
Multiple logistic regression analysis of PCI and NVAFV
ROC analysis of NVAFV for PCI
The ROC curve analysis identified an NVAFV cut-off value of 168.21 as a threshold to identify patients at high risk for PCI (sensitivity 0.725, specificity 0.576, area under curve 0.683, Youden’s index 0.301).
Proportion of PCI under the combined effect of different bilateral VA flow volumes and contralateral VA stenosis grades
We divided the patients into four groups according to the NVAFVs separated by the threshold of 168.21 and contralateral VA stenosis grades to determine PCI distribution. Group 1 was defined as contralateral VA non-severe stenosis (CVAS(−)) and H-NVAFV. Group 2 was defined as contralateral VA severe stenosis (CVAS(+)) and H-NVAFV. Group 3 was defined as CVAS(−) and L-NVAFV. Group 4 was defined as CVAS(+) and L-NVAFV. The proportion of PCI gradually increased among the four groups. Group 1 had the lowest proportion of PCI (25.4%), whereas PCI was more frequently observed in group 4 (86.0%). In addition, group 3 had a higher prevalence of PCI than group 2 (56.6% vs 42.9%) (figure 3).
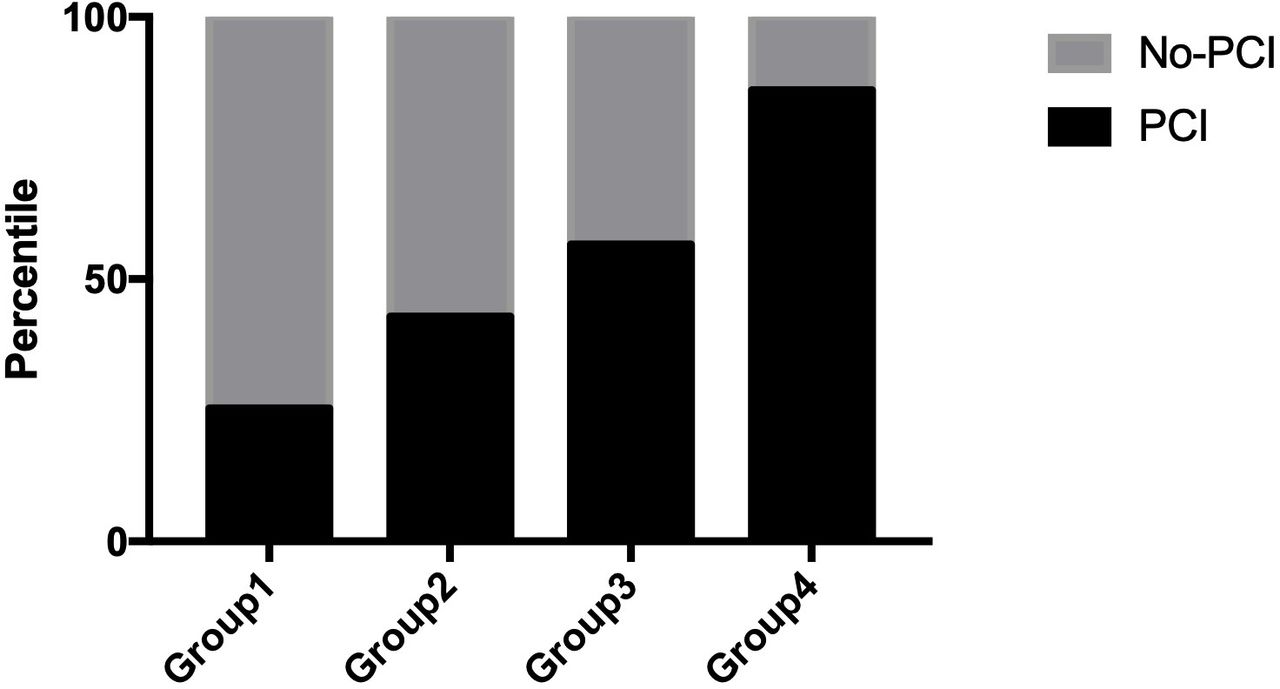
Distribution of PCI in each group divided by NVAFV and grades of contralateral VA stenosis. Group 1. CVAS(−) and H-NVAFV; group 2. CVAS(+) and H-NVAFV; group 3. CVAS(−) and L-NVAFV; group 4. CVAS(+) and L-NVAFV. CVAS, contralateral VA non-severe stenosis; H-NVAFV, higher net flow volume; L-NVAFV, lower NVAFV; PCI, posterior circulation infarction.
Percentile of different pathological mechanisms of PCI in the four groups
LAA was the most frequent pathological mechanism of PCI in group 4 and the least frequent in group 1 (69.1% vs 8.3%). The pathological mechanism Br A for PCI was equally distributed among the four groups. LAA was more prevalent in group 3 than in group 2 (28.1% vs 15.1%). Figure 4 provides detailed information about these four groups in this regard.

Distribution of PCI mechanisms in each group. Group 1. CVAS(−) and H-NVAFV; group 2. CVAS(+) and H-NVAFV; group 3. CVAS(−) and L-NVAFV; group 4. CVAS(+) and L-NVAFV. Mechanism classification: 1. Branch artery occlusive disease; 2. Large-artery atherosclerosis; 3. No PCI lesion. CVAS, contralateral VA non-severe stenosis; H-NVAFV, higher net flow volume; L-NVAFV lower NVAFV; PCI, posterior circulation infarction.
Follow-up recurrent ischaemic events in the L-NVAFV and H-NVAFV groups
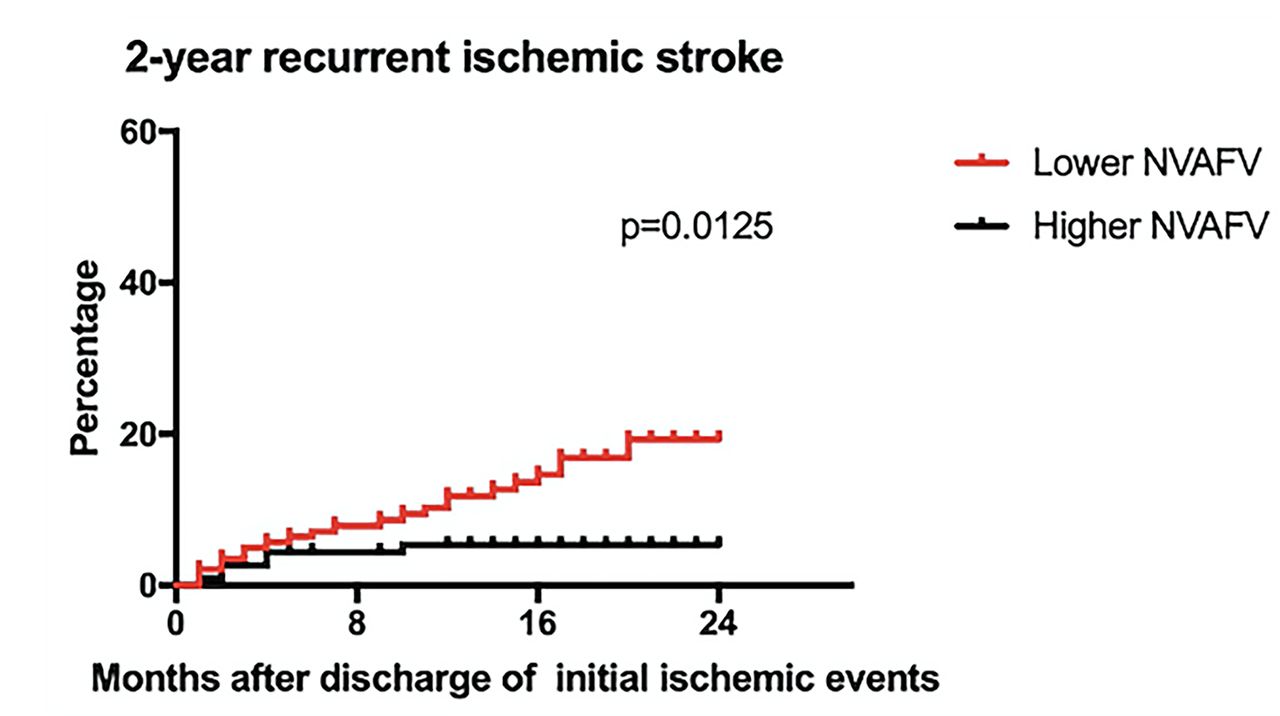
A total of 262 (81.6%) patients completed the 2-year follow-up. On comparing the 2-year recurrent ischaemic stroke incidence between the lower and H-NVAFV groups, the lower NVAFV group showed a higher incidence of stroke (HR 2.978, 95% CI 1.414 to 6.272, p=0.0125; figure 5, online supplemental table 2 than the H-NVAFV group.

Recurrent ischaemic events between different level of net flow volume (NVAFV). Lower NVAFV group showed higher incidence of subsequent cerebral ischaemic events than higher NVAFV group.
Discussion
Our study demonstrated that NVAFV, which is calculated using extracranial VA ultrasound, may represent an effective means to screen high-risk patients as a target population for future endovascular intervention. NVAFV was associated with non-cardioembolic PCI in patients with severe unilateral or bilateral VA stenosis, especially via the LAA mechanism. In patients with different contralateral VA stenosis grades, NVAFV exhibited a superior effect, representing the adequacy of the posterior circulation.
Previous research has discovered that the normal range of NVAFV is 102.4–301.0 mL/min (fifth–95th percentile) and that NVAFV of <100 mL/min is considered abnormal.11 The odds of non-cardioembolic PCI with NVAFV of <90 and 100 mL/min were reported to be 3.26 and 3.48, respectively, in Lee et al.’s study.13 In our study, the prevalence of PCI or PCI +TIA was higher in the lowest NVAFV group than in the highest NVAFV group, which is consistent with the findings of a previous study.
According to the comprehensive overview by Lattanzi et al 19 of four available randomised clinical trials, including Carotid and Vertebral Artery Transluminal Angioplasty Study, VAST, VIST and Stenting and Aggressive Medical Management for Preventing Recurrent stroke in Intracranial Stenosis, which focus on comparing EVT plus medical treatment and medical treatment alone for patients with symptomatic intracranial and extracranial vertebrobasilar system stenosis, no superiority effect of EVT for symptomatic VA stenosis was found either in the short-term or long-term on the occurrence of stroke or composite vascular outcome. Nevertheless, the author reported some findings that are worthy of note. First, all the trials enrolled patients with extracranial and intracranial VA stenosis as their target population. Existing data displayed a higher risk of recurrent ischaemia in intracranial VA stenosis than in extracranial stenosis.2 The treatment benefit may vary according to the stenosis location; however, none of the trials considered the stenosis site in analysing different endpoints. This was also proposed by Drazyk and Markus,20 with a review focusing on the stenosis site difference. Second, both the VIST and VAST clinical trials chose patients with >50% symptomatic vertebrobasilar stenosis as their target population for endovascular intervention.7 9 In the VIST study, a high proportion of patients was included in the stent group who were found not to have stenosis. The effect of EVT might be masked under these circumstances since Guppy et al claimed that patients with >70% stenosis of the vertebrobasilar system could have a profound flow volume change after angioplasty; however, for patients with only 50% stenosis, flow volume remained consistent after angioplasty.21 Stenting was used to augment the stenotic lumen to increase the flow volume and reduce the LAA incidence in PCI. Therefore, the greatest beneficiaries of stents were those with significantly reduced blood flow volume. In the ostial VA stenosis study, patients with bilateral VA pathology showed a significantly lower long-term risk of cerebral ischaemia recurrence after endovascular therapy.22 Third, EVT displayed an increasing periprocedural complication rate in the randomised trials. Hence, higher specificity for selecting high-risk flow compromised patients was much more important than higher sensitivity to perform EVT. Highly specific stratification method is, therefore, more urgent and useful to identify the target population, which could prevent unnecessary interventions and complication risks in order to create a favourable balance between recurrent stroke events and periprocedural risk. In the present study, we demonstrated that reduced NVAFV was a strong predictor for PCI, especially via the LAA mechanism. Compared with stenosis grade, blood flow volume had a significant association with the prevalence of diseases. NVAFV would be a robust method to screen high-risk flow compromised patients in VA stenosis. A large multicentre cohort study should be conducted in the future to investigate the risks and benefits of EVT in the higher risk population with NVAFV stratification.
Other investigators have measured distal blood flow volume in the VA using quantitative magnetic resonance angiography and have shown that reduced distal blood volume is associated with a higher risk of subsequent PCI during follow-up,23 whereas patients with normal distal flow volume have a low risk of subsequent stroke and do not require any intervention. This conclusion is consistent with our observations. Our follow-up examination demonstrated that lower NVAFV was associated with subsequent incidence of cerebral ischaemic events. However, because the positive events in our study were very few, we did not perform subgroup analysis. A part of the infarcted population may have had an anterior circulation infarction; this is a limitation of our study. We intend to continue this research to expand the sample size, thus allowing valid subgroup analysis.
Blood flow measurements in the internal carotid arteries and VA using CDU agreed with those measured using phase-contrast MRI, as reported previously.12 24 Since VA morphology is relatively uniform, NVAFV can be measured anywhere in the cervical VA. As flow volume measured with CDU was consistent that measured with phase-contrast MRI, we believe that NVAFV calculated by CDU could be an effective, convenient and accurate substitution.
In our study, severe anterior artery stenosis was predominant in the H-NVAFV group. Although few studies have investigated VA flow volume changes in patients with severe carotid artery disease, one study has reported an increase in NVAFV in patients with unilateral extracranial internal carotid artery occlusion.25 Our study findings support this idea and demonstrated the same results for anterior artery disease. We analysed this specific population separately using a multiple factor analysis because a H-NVAFV is not a physiological event. In this patient population, given that the OR of PCI with lower flow volume was 14.03, as opposed to only 2.76 in patients without severe anterior arterial stenosis, we cannot overlook carotid stenosis in patients with lower NVAFV. A treatment strategy for the extracranial VA should be considered for patients with severe carotid artery stenosis and decompensation of the VA flow volume.
Our study also found that severe contralateral VA stenosis was a predictor for PCI; however, the influence was not as significant as that of NVAFV. It tended to correlate with PCI findings in patients without severe anterior artery stenosis; however, the relationship was not observed in patients with severe carotid artery stenosis. We found that the severe contralateral VA stenosis group exhibited an increased prevalence of PCI compared with the non-severe contralateral VA stenosis group. Under the same condition of severe contralateral VA stenosis, lower NVAFV was associated with a marked elevation in PCI compared with H-NVAFV. For strict and precise screening of the target population, NVAFV seemed to be more useful.
Some researchers believe that hypoplasia is a predictor for PCI or TIA.26–28 There is no consensus on the definition of hypoplasia, and a retrospective analysis has shown that VA of <2 mm in diameter is predominant in patients with PCI. Another study that has defined VA hypoplasia as a diameter of <2.5 mm has found that VA hypoplasia is frequent in patients with PCI. In our research group, we found that hypoplasia had no impact on PCI compared with severe stenosis. A partial reason for this is that the majority of our patient population was older than 65 years. In a previous study, the association between hypoplasia and PCI was found to be valid only in patients younger than 65 years.26 Another reason may be that we defined hypoplasia in our patient population as a diameter of <2.5 mm, which may not affect PCI.
Our study had several limitations. First, this was a retrospective study. Second, there were two types of populations in our non-PCI group, including patients with asymptomatic and anterior circulation infarction. Although we analysed the relationship between severe anterior artery stenosis and NVAFV separately, anterior circulation infarcts induced by small vessel disease may still influence the regional flow volume in the posterior circulation system. Third, NVAFV was calculated in patients with PCI, and we could only infer that there was a relationship between NVAFV and PCI, but we could not establish the cause. Finally, because of the small number of positive events noted during follow-up, we could not perform a precise subgroup analysis. As a next step, we plan to conduct a large size prospective cohort study to further define the relationship between flow volume and recurrent stroke events.
Conclusion
Our study demonstrated that NVAFV, as estimated by CDU, was associated with PCI and subsequent ischaemic events, especially in the LAA group, and we could identify a high-risk population for further revascularisation. In patients with simultaneous severe carotid artery disease, decompensation of the VA flow volume should trigger an alert for revascularisation.
Data availability statement
Data are available upon reasonable request. Not applicable.
Ethics statements
Patient consent for publication
Ethics approval
This retrospective cohort study was approved by the Ethics Committee of Capital Medical University Xuan Wu Hospital.
References
Supplementary material
Supplementary Data
This web only file has been produced by the BMJ Publishing Group from an electronic file supplied by the author(s) and has not been edited for content.
Footnotes
QL and YZ contributed equally.
Contributors QL collected the data, conducted data analysis and wrote the manuscript. YZ conceived the project and collected the data. YX revised the manuscript and commented on the data. JY offered important inputs on the results. YH was involved in the study design and manuscript revision. YH was responsible for the overall content as the guarantor. YH accepted full responsibility for the work, had access to the data, and controlled the decision to publish.
Funding The authors have not declared a specific grant for this research from any funding agency in the public, commercial or not-for-profit sectors.
Competing interests None declared.
Provenance and peer review Not commissioned; externally peer reviewed.
Supplemental material This content has been supplied by the author(s). It has not been vetted by BMJ Publishing Group Limited (BMJ) and may not have been peer-reviewed. Any opinions or recommendations discussed are solely those of the author(s) and are not endorsed by BMJ. BMJ disclaims all liability and responsibility arising from any reliance placed on the content. Where the content includes any translated material, BMJ does not warrant the accuracy and reliability of the translations (including but not limited to local regulations, clinical guidelines, terminology, drug names and drug dosages), and is not responsible for any error and/or omissions arising from translation and adaptation or otherwise.