Article Text

Abstract
China faces the greatest challenge from stroke in the world. According to results from the Global Burden of Disease Study 2019, there were 3.94 million new stroke cases, 28.76 million prevalent cases and 2.19 million deaths due to stroke in China in 2019. Furthermore, stroke is also the leading cause of disability-adjusted life-year (DALY) in China, the number of DALYs reached 45.9 million in 2019. Several recent large-scale epidemiological surveys have updated the data on pre-existing conditions contributed to stroke. The age-adjusted prevalence of overweight among Chinese adults aged 18–69 years was 34.4%, and the prevalence of obesity was 16.8% in 2018. 50.9% of Chinese adults ≥18 years of age without history of hypertension had prehypertension in 2018. The weighted prevalence of hypertension in adults was 27.5% in 2018. The weighted prevalence of total diabetes and pre-diabetes diagnosed by the American Diabetes Association criteria were 12.8% and 35.2%, respectively, among Chinese adults ≥18 years of age in 2017. The weighted atrial fibrillation prevalence was 1.8% among Chinese adults ≥45 years of age and equates to being present in an estimated 7.9 million people in China. Data from 1672 tertiary public hospitals in the Hospital Quality Monitoring System (HQMS) showed that 3 411 168 stroke cases were admitted during 2019. Of those, 2 818 875 (82.6%) were ischaemic strokes (ISs), 485 474 (14.2%) were intracerebral haemorrhages (ICHs), 106 819 (3.1%) were subarachnoid haemorrhages (SAHs). The average age was 66 years old, and 59.6% were male. A total of 1379 (<0.1%), 2604 (0.5%), 1250 (1.2%) paediatric strokes (age <18 years) were identified among IS, ICH and SAH, respectively. Over one-third (1 231 519 (36.1%)) of the stroke cases were covered by urban resident basic medical insurance, followed by urban employee basic medical insurance (891 103 (26.1%)) and new rural cooperative medical schema (543 108 (15.9%)). The leading risk factor was hypertension (57.3% for IS, 69.9% for ICH and 44.1% for SAH), and the leading comorbidity was pneumonia or pulmonary infection (10.4% for IS, 34.6% for ICH and 29.7% for SAH). In-hospital death/discharge against medical advice rate was 8.5%, ranging from 6.0% for IS to 20.6% for SAH. The median and IQR of length of stay was 9.0 (6.0–13.0) days, ranging from 10.0 (7.0–13.0) in IS to 14.0 (8.0–22.0) in ICH. Similar data from 2847 secondary public hospitals or private hospitals in the HQMS were also reported. Data from HQMS showed that higher proportions of interprovincial admission to other provinces were seen in Inner Mongolia, Anhui, Tibet and Beijing. Higher proportions of interprovincial admission from other provinces were seen in Beijng, Tianjin, Shanghai and Ningxia. Data from 323 601 strokes from 1337 hospitals in the Chinese Stroke Center Alliance during 2019 demonstrated that the composite scores of guideline-recommended key performance indicators for patients with IS, ICH and SAH were 0.78±0.20, 0.69±0.27 and 0.60±0.31, respectively.
- stroke
This is an open access article distributed in accordance with the Creative Commons Attribution Non Commercial (CC BY-NC 4.0) license, which permits others to distribute, remix, adapt, build upon this work non-commercially, and license their derivative works on different terms, provided the original work is properly cited, appropriate credit is given, any changes made indicated, and the use is non-commercial. See: http://creativecommons.org/licenses/by-nc/4.0/.
Statistics from Altmetric.com
Introduction
Stroke was the third highest cause of death of China1 and the leading cause of disability-adjusted life-year (DALY) in China in 2019.2 Stroke has imposed an enormous disease burden on the healthcare system in China. In the past decades, several registry studies have been launched, including the China National Stroke Registries (CNSR-I, CNSR-II and CNSR-III),3–5 which continue to provide timely evidence for clinical practice and scientific research. The current report is an update of the China Stroke Statistics 2019 report,6 using the best contemporary data source, if available.
Methods
The current report is an update to the report published in 2019. It contains the most up-to-date statistics related to stroke and its attributable risk factors, including core health behaviours (smoking, diet and weight) and pre-existing conditions (hypertension, diabetes mellitus, dyslipidaemia and atrial fibrillation (AF)).
Data sources
Findings of stroke and related risk factors were extracted from published literature and surveillance reports. In this statistical update, the results of Global Burden of Disease (GBD) study 20192 is used for the incidence, prevalence and mortality of stroke. In the section of risk factors in general population, data on obesity, hypertension, diabetes and AF are updated. China Chronic Disease and Risk Factors Surveillance (CCDRFS) (2018) is used to present estimates of the percentage of people with overweight,7 obesity,7 prehypertension8 and hypertension.8 The Epidemiological Survey of Thyroid disease, Iodine status and Diabetes (2017) is used for the prevalence of diabetes.9 The prevalence of AF10 is obtained from China Atrial Fibrillation Epidemiologic Study (2014–2016). The data on risk factors in stroke survivors and part of risk factors in general population, including tobacco use, food and nutrition, cholesterol and other lipids are unchanged from China Stroke Statistics 2019. The methodology of data sources and definition of key indicators for stroke related risk factors are shown in supplemental methods.
Patient demographic characteristics, comorbidities, procedure/operations and in-hospital outcomes were extracted from the Hospital Quality Monitoring System (HQMS) 201911; in-hospital key performance indicators were extracted from the Chinese Stroke Center Alliance (CSCA) 2019.12 13 More details were described in the China Stroke Statistics 2019 report.6 In addition, standardised inpatient discharge records from secondary public hospitals or private hospitals were also available in HQMS. Therefore, we extracted, analysed, and reported these data in the current report. The contents of this report have been internally and externally reviewed and approved by the National Centre for Healthcare Quality Management in Neurological Diseases.
Identification of diagnosis for stroke, comorbidities and procedures
Stroke diagnosis and comorbidities in HQMS were identified by main diagnosis using National Clinical V.2.0 of the International Classification of Diseases, 10th Revision, disease codes. Stroke diagnosis in CSCA was determined at discharge. Procedures or interventions were identified by International Classification of Diseases, Ninth Revision, Clinical Modification, volume 3 (online supplemental eTable 1).
Supplemental material
Key performance indicators
A total of 11 guideline-recommended performance metrics of in-hospital management were prespecified for this study based on the national guidelines and the Get With The Guidelines-Stroke criteria. Detailed definitions are listed in online supplemental eTable 2.
In-hospital outcomes measures
In-hospital outcomes were analysed based on data from HQMS. In-hospital outcome was classified as discharge as planned, transfer to another hospital and death or discharge against medical advice (DAMA). We used the composite come of death or DAMA to reflect a unique discharge pattern in China that patients would like to withdraw from treatment at unfavourable or terminal status and willing to return home in China.12 14 In addition, we also assessed length of stay, total fee and out of pocket money in the current report.
Definition of interprovincial admission
Patients often seek medical treatment across provinces. Therefore, we analysed interprovincial admission at province level based on data from the HQMS. Interprovincial admission was defined as a patient admitted to a hospital out of his or her resident province. Interprovincial admission to other provinces and interprovincial admission from other provinces were assessed and visualised by Sankey diagrams for every province. The top five provinces with high proportions of interprovincial admission for ischaemic stroke (IS), intracerebral haemorrhage (ICH) and subarachnoid haemorrhage (SAH) are highlighted.
Statistical methods
Data were presented as means with SD or medians with IQRs for continuous variables and as frequencies with percentages for categorical variables. We did not report p values because large sample sizes in HQMS and CSCA would likely yield statistically significant p values with small absolute differences that may not be clinically meaningful. All statistical analyses were performed using SAS V.9.4. To enhance the speed and efficiency of report creation and presentation, a SAS macro called % ggBaseline was used to analyse and report results automatically.15 Sankey diagrams were graphed by R package networkD3.16
Results
Stroke burden
Incidence
According to results from the GBD Study 2019,2 there were 3.94 million new stroke cases in China in 2019, 2.87 million were IS, 0.85 million were ICH, and 0.22 million were SAH. The incidence rate of stroke was 276.7 per 100 000 population in 2019, 269.2 per 100 000 population for male and 284.5 per 100 000 population for female.
The age-standardised incidence rate of stroke declined by 9.3% from 1990 to 2019. Among different stroke subtypes, the age-standardised incidence rates of ICH and SAH similarly decreased by 53.1% and 39.3%, respectively. But the age-standardised incidence rate of IS increased by 34.7% from 1990 to 2019 (table 1).
Age-standardised incidence rate of stroke in 2019 and percentage changes from 1990 and by sex and stroke subcategories in China
Prevalence
According to results from the GBD Study 2019,2 among 28.76 million prevalent cases of stroke in 2019, 24.18 million were IS, 4.36 million were ICH, and 1.58 million were SAH. In 2019, the prevalence rate of stroke was 2022.0 per 100 000 population, 1770.7 per 100 000 population for male and 2283.2 per 100 000 population for female.
The age-standardised prevalence rate of stroke increased by 13.2%, as did that of IS (33.5%) from 1990 to 2019. However, the age-standardised prevalence of ICH decreased by 31.9% and that of SAH by 21.9% from 1990 to 2019 (table 2).
Age-standardised prevalence rate of stroke in 2019 and percentage changes from 1990 and by sex and stroke subcategories in China
Mortality rate
According to results from the GBD Study 2019,2 there were 2.19 million deaths due to stroke in 2019, 1.03 million were IS, 1.07 million were ICH, and 0.09 million were SAH. The crude mortality rate of stroke was 153.9 per 100 000 population in 2019, 174.0 per 100 000 population for male and 133.1 per 100 000 population for female. The number of deaths and mortality rate were much higher among males than females for all stroke subcategories in 2019.
The age-standardised mortality rate of stroke decreased by 39.8%, reaching 127.2 per 100 000 population in 2019. The largest decrease in age-standardised mortality rate was in SAH (–84.1%), followed by ICH (–48.1%) from 1990 to 2019 (table 3).
Age-standardised mortality rate of stroke in 2019 and percentage changes from 1990 and by sex and stroke subcategories in China
Disease burden
According to results from the GBD Study 2019,2 stroke is also the leading cause of DALY in China, the number of DALYs reached 45.9 million in 2019. The DALYs of stroke increased by 36.7% from 1990 to 2019. The changes in DALYs of stroke were inconsistent among different subtypes. The DALYs of IS increased by 138.6%, but the DALYs of SAH decreased by 59.0%. Similar trends were also observed for YLLs from 1990 to 2019. The YLLs of IS increased by 124.4%, but the YLLs of SAH decreased by 63.2%. YLDs due to stroke and its subtypes increased from 1990 to 2019, with the highest increase in IS (202.7%).
The age-standardised DALY rate was 2412.5/100,000 in 2019. A substantial reduction (–41.6%) in the age-standardised DALY rate was found from 1990 to 2019, with a greater reduction among females (–49.4%) than among males (–34.5%). Moreover, the age-standardised YLD rate increased by 15.9%, but the age-standardised YLL rate decreased by 45.7% from 1990 to 2019 (table 4).
Age-standardised rate for stroke DALYs, YLLs and YLDs in 2019 and percentage changes from 1990 and by sex and stroke subcategories in China
Risk factors in general population
Health behaviours
The data on health behaviours, such as smoking/tobacco use, food and nutrition are unchanged from China Stroke Statistics 2019.
Overweight and obesity
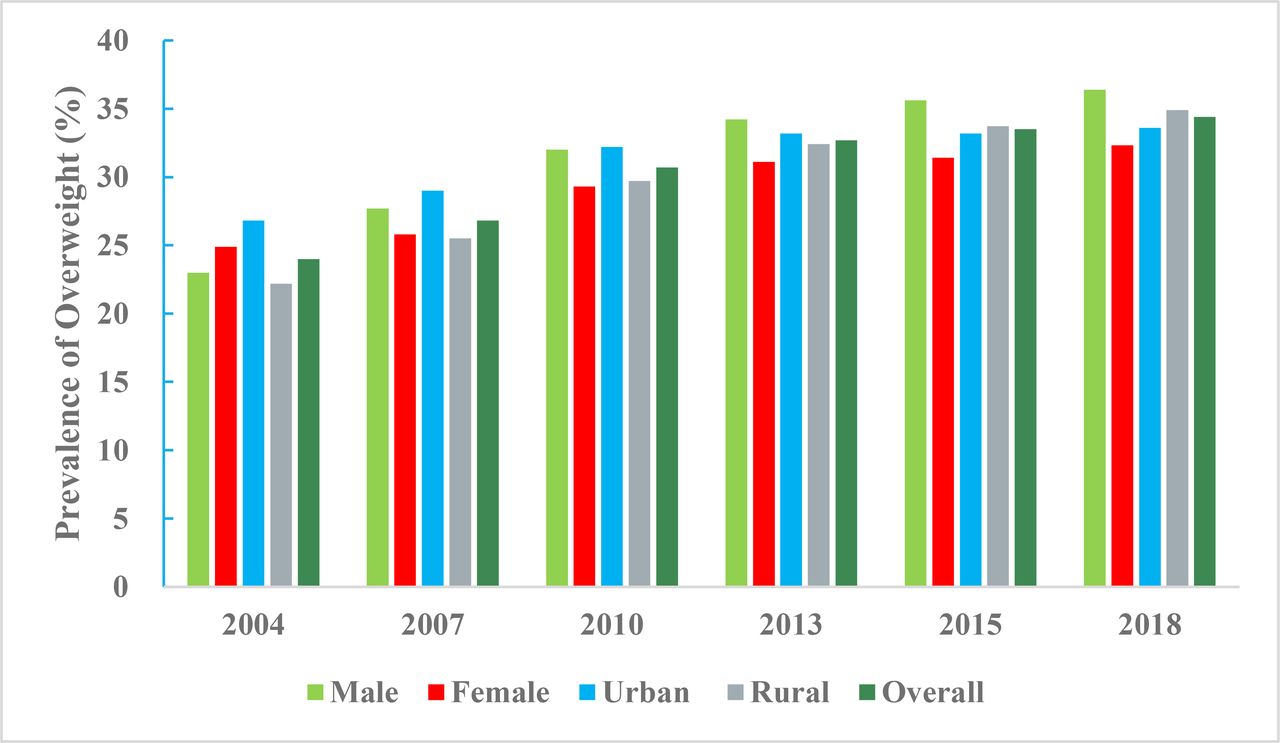
According to data from the CCDRFS programme, the aged-adjusted prevalence of being overweight among Chinese adults aged 18–69 years was 34.4% (36.4% of men and 32.3% of women, 33.6% in urban areas and 34.9% in rural areas) and the prevalence of obesity was 16.8% (18.8% of men and 14.8% of women, 17.7% in urban areas and 16.1% in rural areas) in 2018. These body mass index (BMI) cut-offs for defining overweight and obesity are based on the Chinese standard. In contrast, the aged-adjusted prevalence of overweight or obesity were lower when defined according to the WHO standard (32.8% and 8.1%, respectively). The age-standardised prevalence of overweight or obesity increased significantly from 2004 to 2018; using BMI definitions according to the Chinese standard, overweight prevalence rose from 24.0 % to 34.4 % (figure 1) and obesity prevalence increased from 7.1% to 16.8% (figure 2).

Prevalence of overweight among Chinese adults aged 18–69 years by sex and regions, China Chronic Disease and Risk Factors Surveillance programme, from 2004 to 2018 (Chinese BMI cut-offs). BMI, body mass index.
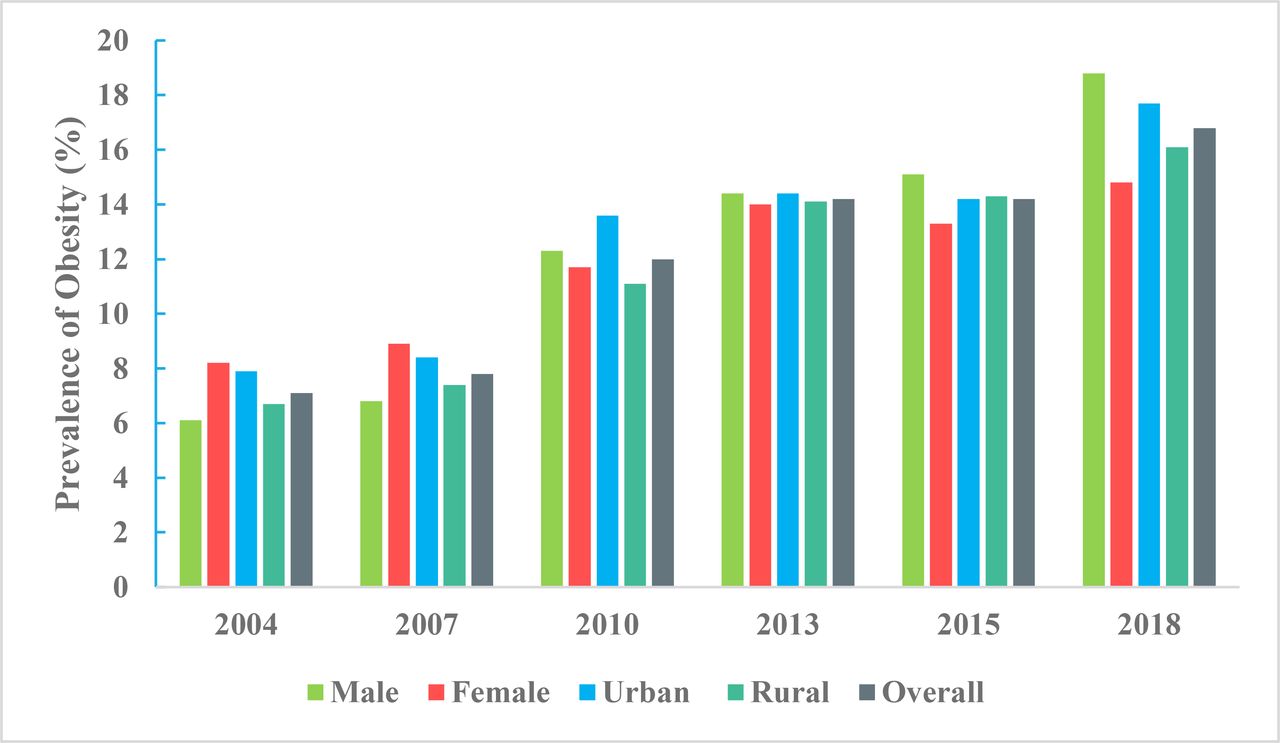
Prevalence of obesity among Chinese adults aged 18–69 years by sex and regions, China Chronic Disease and Risk Factors Surveillance programme, from 2004 to 2018 (Chinese BMI cut-offs). BMI, body mass index.
High blood pressure
Prevalence
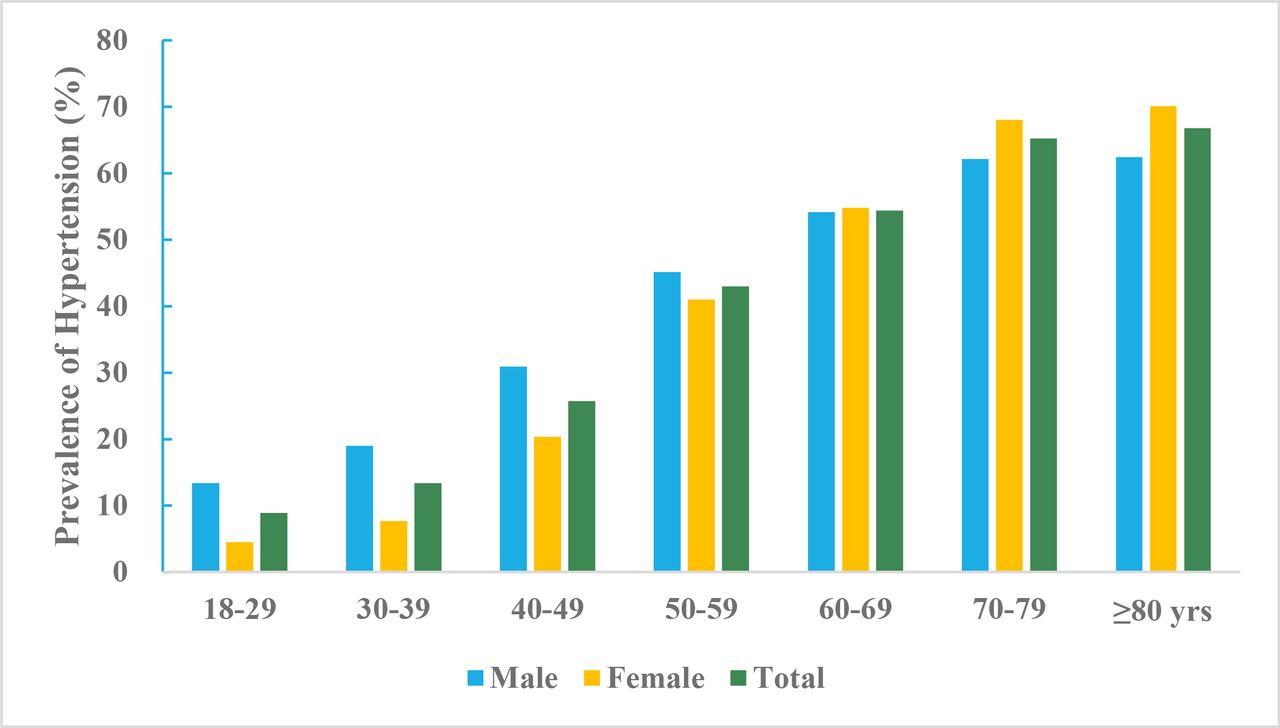
According to data from the CCDRFS programme, 50.9% Chinese adults ≥18 years of age without history of hypertension had prehypertension in 2018. The weighted prevalence of hypertension in adults was 27.5% (30.8% for men and 24.2% for women) in 2018. The rural adults had higher hypertension prevalence rate (29.4%) compared with urban adults (25.7%). The age-specific prevalence of hypertension increased with older age in both men and women (figure 3).

Prevalence of hypertension among Chinese adults ≥18 years of age by sex and age groups, China Chronic Disease and Risk Factors Surveillance programme, 2018.
Awareness, treatment and control
According to data from the CCDRFS programme, among the adults with hypertension, 41.0% were aware of their sick status, 34.9% were taking antihypertensive medicines, and 11.0% had their blood pressure controlled. In the hypertensive patients, women and urban residents were more likely to have higher rates of awareness, treatment and control of hypertension compared with men and rural residents (figure 4).
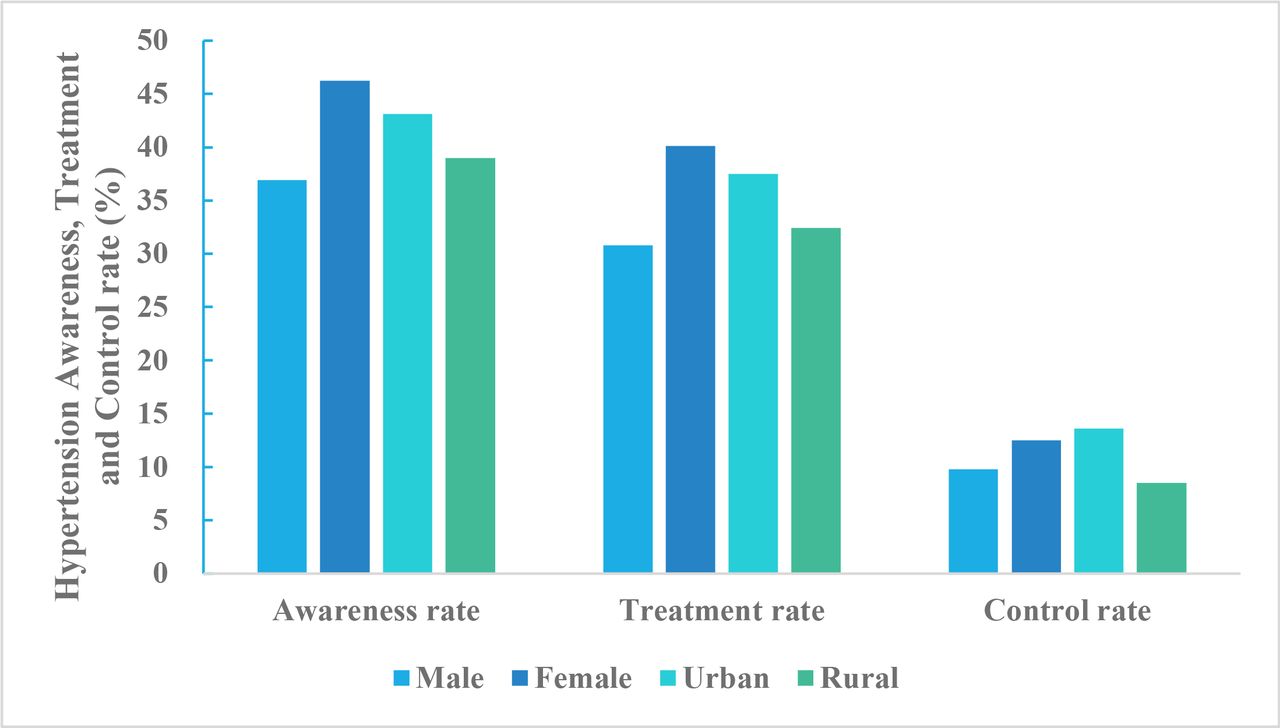
Hypertension awareness, treatment and control rate for Chinese adults ≥18 years of age by sex and region, China Chronic Disease and Risk Factors Surveillance programme, 2018.
Diabetes mellitus
Prevalence
According to the data from Thyroid disorders, Iodine status and Diabetes Epidemiological Survey study, the weighted prevalence of total diabetes, self-reported diabetes, newly diagnosed diabetes and pre-diabetes diagnosed by the American Diabetes Association criteria were 12.8%, 6.0%, 6.8%, and 35.2%, respectively, among Chinese adults ≥18 years of age in 2017.
The prevalence of diabetes continues to increase in China. The weighted prevalence of total diabetes diagnosed by the WHO criteria increased from 9.7% in 2007, to 10.4% in 2013, and to 11.2% in 2017 (figure 5). The weighted prevalence of pre-diabetes rose from 15.5% in 2007 to 18.1% in 2017.
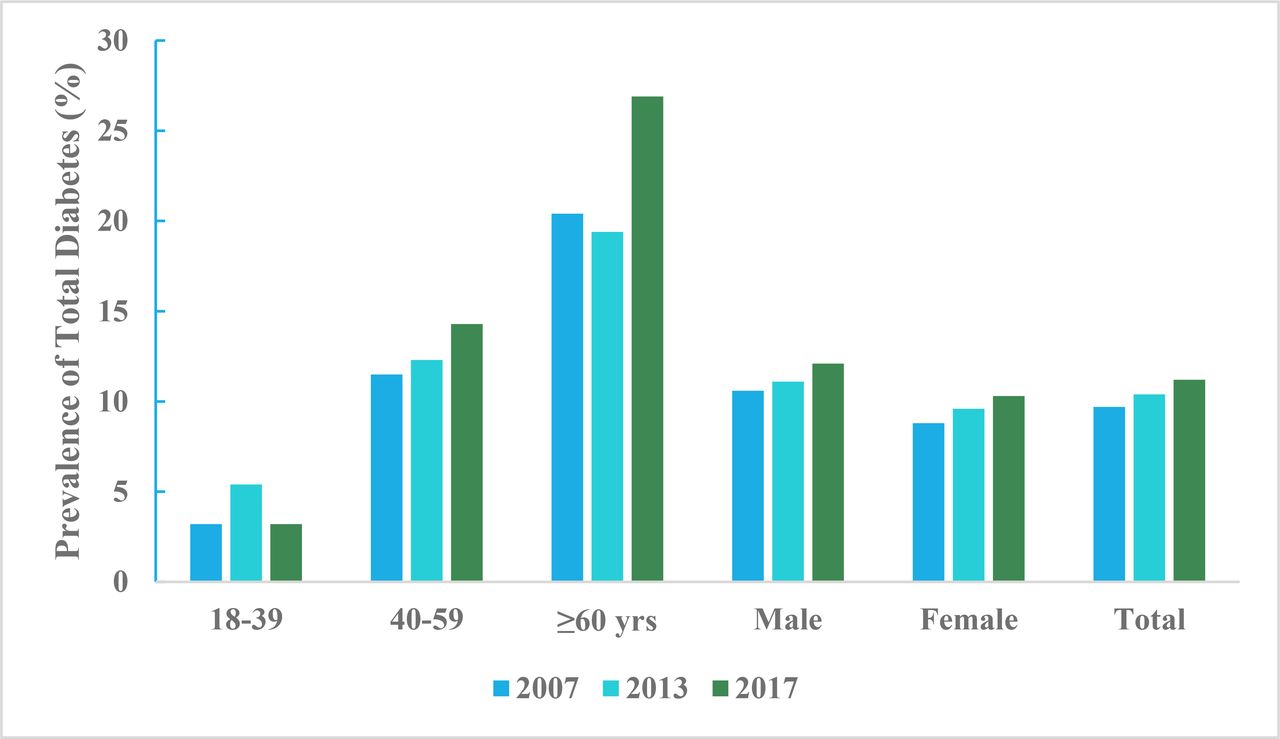
Prevalence of total diabetes diagnosed by the WHO criteria among Chinese adults≥18 years of age by sex and age group from 2007 to 2017.
Awareness, treatment and control
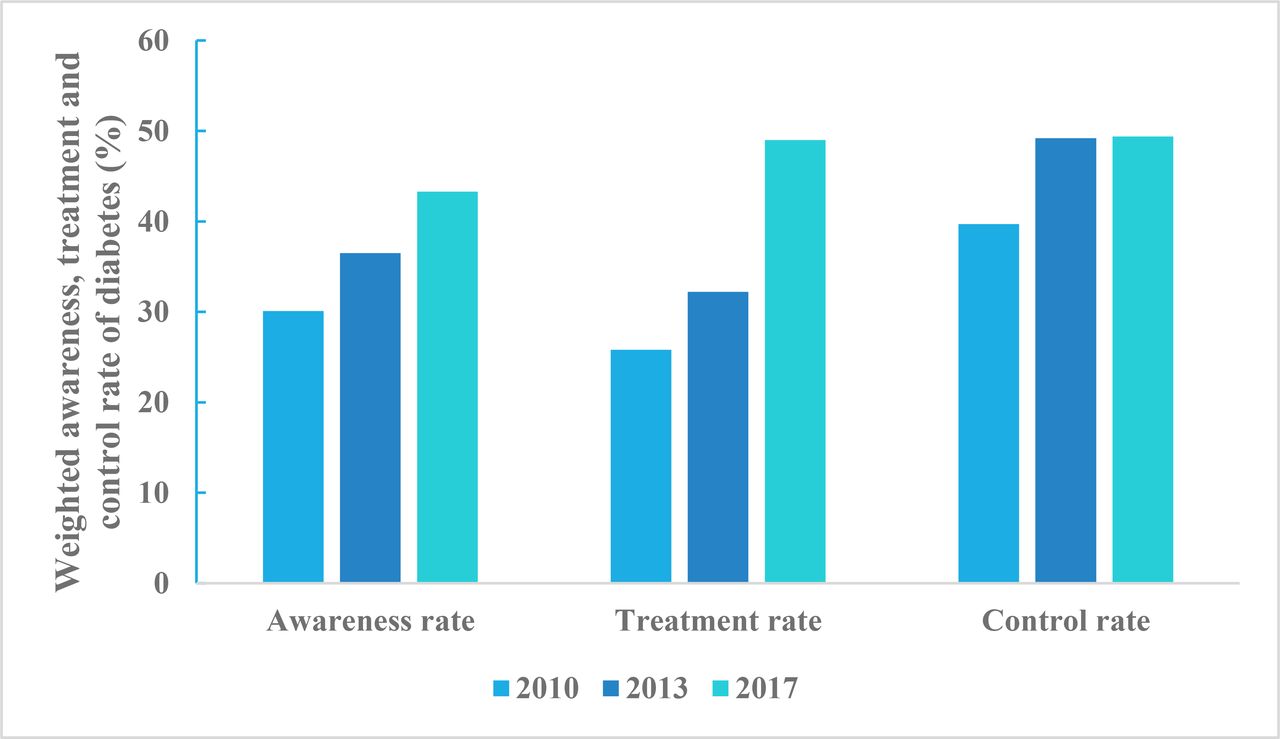
The awareness rate and treatment rate of diabetes in 2017 was significantly higher than that in 2010 and 2013. The percentage control of diabetes in the 2017 survey was improved in comparison with the 2010 survey but remained the same as in the 2013 survey (figure 6).

Weighted awareness rate, treatment rate and control rate of diabetes among Chinese adults ≥18 years of age from 2010 to 2017.
High blood cholesterol and other lipids
The data on the prevalence of dyslipidaemia and its screening, awareness and treatment rate are unchanged from China Stroke Statistics 2019.
Atrial fibrillation
Prevalence
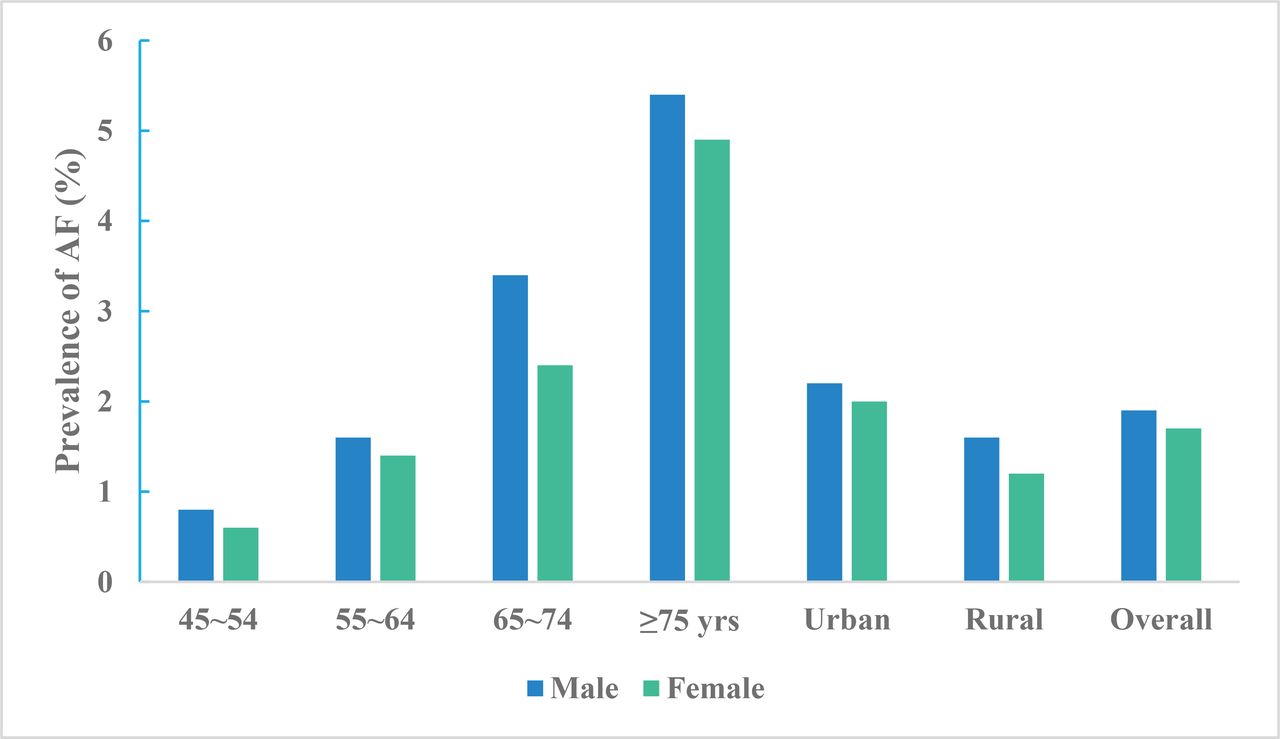
According to the data from the China Atrial Fibrillation Epidemiologic Study in China between 2014 and 2016. The weighted AF prevalence was 1.8% (2.1% in urban and 1.4% in rural area) among Chinese adults ≥45 years of age and equates to being present in an estimated 7.9 million people in China. Among men and women, the AF prevalence increased from 0.8% and 0.6% in the age group 45–54 years to 5.4% and 4.9% in the age group ≥75 years, respectively (figure 7).
Prevalence of atrial fibrillation among adults aged ≥45 years by sex, age and region, China Atrial Fibrillation Epidemiologic Study 2014–2016.
Awareness
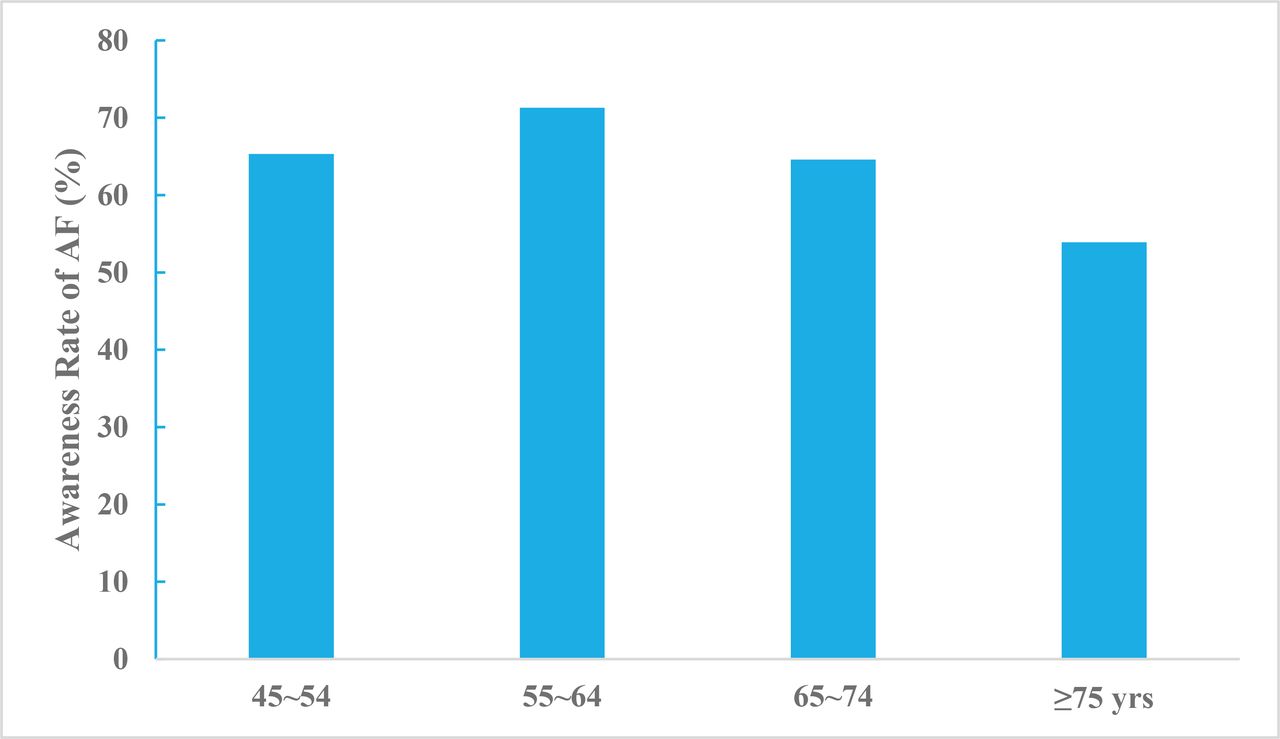
Proportions of people who were aware of having AF rose and fell in four age groups (figure 8) and varied between sex (men 58.5%, women 68.8%) and residency status (urban 78.3%, rural 35.3%). Only 6.0% of patients with high-risk AF received anticoagulation therapy.

Awareness rate of atrial fibrillation among adults aged ≥45 years by age, China Atrial Fibrillation Epidemiologic Study 2014–2016.
Inpatient characteristics
Admission
A total of 3 411 168 and 3 154 444 stroke cases admitted during 2019 were identified from 1672 tertiary public hospitals and 2847 secondary public hospitals/private hospitals in HQMS, respectively (figures 9 and 10). Of those, over 80% were ISs (82.6% and 88.0% for tertiary public hospitals and secondary public hospitals/private hospitals, respectively); over 10% were ICH strokes (14.2% and 10.7% for tertiary public hospitals and secondary public hospitals/private hospitals, respectively); less than 5% were SAHs (3.1% and 1.3% in tertiary public hospitals and secondary public hospitals/private hospitals, respectively). ISs were primarily admitted from the clinic (56.3% and 71.5% in tertiary public hospitals and secondary public hospitals/private hospitals, respectively) and ICH and SAH strokes were primarily admitted from the emergency room for tertiary public hospitals but admitted from both the emergency room and clinic for secondary public hospitals/private hospitals. All cases, no matter admitted to tertiary public hospitals or secondary public hospitals/private hospitals, were more likely to be admitted on weekdays, especially on Mondays, and were less likely to be admitted on weekends (table 5).

Distribution of tertiary public hospitals and admitted stroke cases from the Hospital Quality Monitoring System in 2019.
Admission of stroke cases admitted to hospitals in the Hospital Quality Monitoring System in 2019

Distribution of secondary public hospitals/private hospitals and admitted stroke cases from Hospital Quality Monitoring System in 2019.
Inpatient characteristics
Among the 3 411 168 stroke cases admitted to tertiary public hospitals in HQMS, nearly 60% were male. The average age was 65.9 (SD 12.6) years old, and the median age was 66 (IQR 57.0–75.0) years old. Most cases were covered by the urban resident basic medical insurance (URBMI) (36.1%), followed by the urban employee basic medical insurance (UEBMI) (26.1%) and new rural cooperative medical schema (NRCMS) (15.9%). Only 9.1% were self-pay (including off-site medical treatment). For ISs and ICHs, a higher proportion of male cases were admitted compared with female cases. In contrast, more SAHs were female. Compared with other stroke subtypes, SAHs were younger and a higher proportion was self-pay (table 6).
Characteristics of stroke cases admitted to hospitals in the Hospital Quality Monitoring System in 2019
For the 3 154 444 stroke cases admitted to secondary public hospitals/private hospitals in HQMS, similar patterns were shown as cases admitted to tertiary public hospitals. Except that most cases were covered by NRCMS (30.7%), and then followed by the UEBMI (28.3%) and the URBMI (21.0%) (table 6).
Geographical distribution
From tertiary public hospitals in HQMS, Heilongjiang province contributed the largest number of cases for this report (7.8%), followed by Liaoning (7.6%) and Guangdong (7.5%). Ningxia, Qinghai and Tibet contributed less than 1% (table 7). From secondary public hospitals/private hospitals, Henan province contributed the largest number of cases for this report (16.0%), followed by Shandong (10.9%) and Hebei (6.8%). Beijing, Hainan, Ningxia, Qinghai, Tianjin, Tibet contributed less than 1% (table 8).
Geographical of stroke cases admitted to tertiary public hospitals in Hospital Quality Monitoring System in 2019
Geographical of stroke cases admitted to secondary public hospitals or private hospitals in the Hospital Quality Monitoring System in 2019
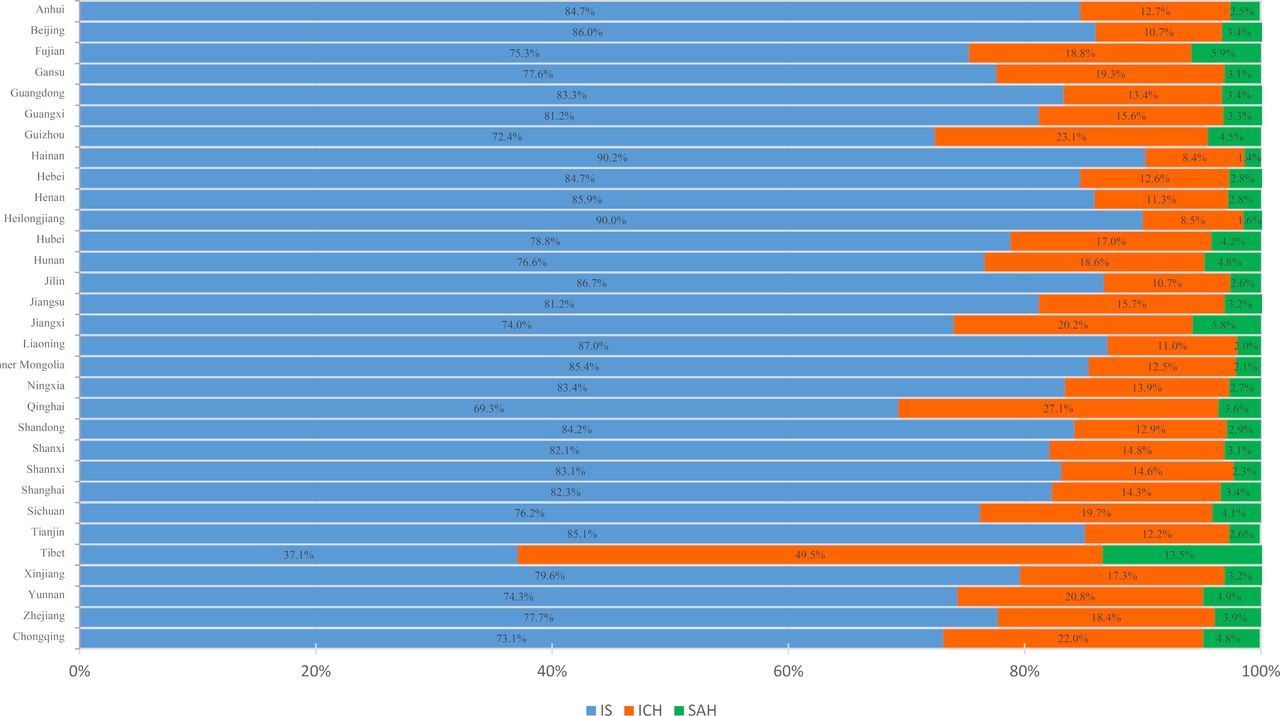
Stroke subtypes by geographical area
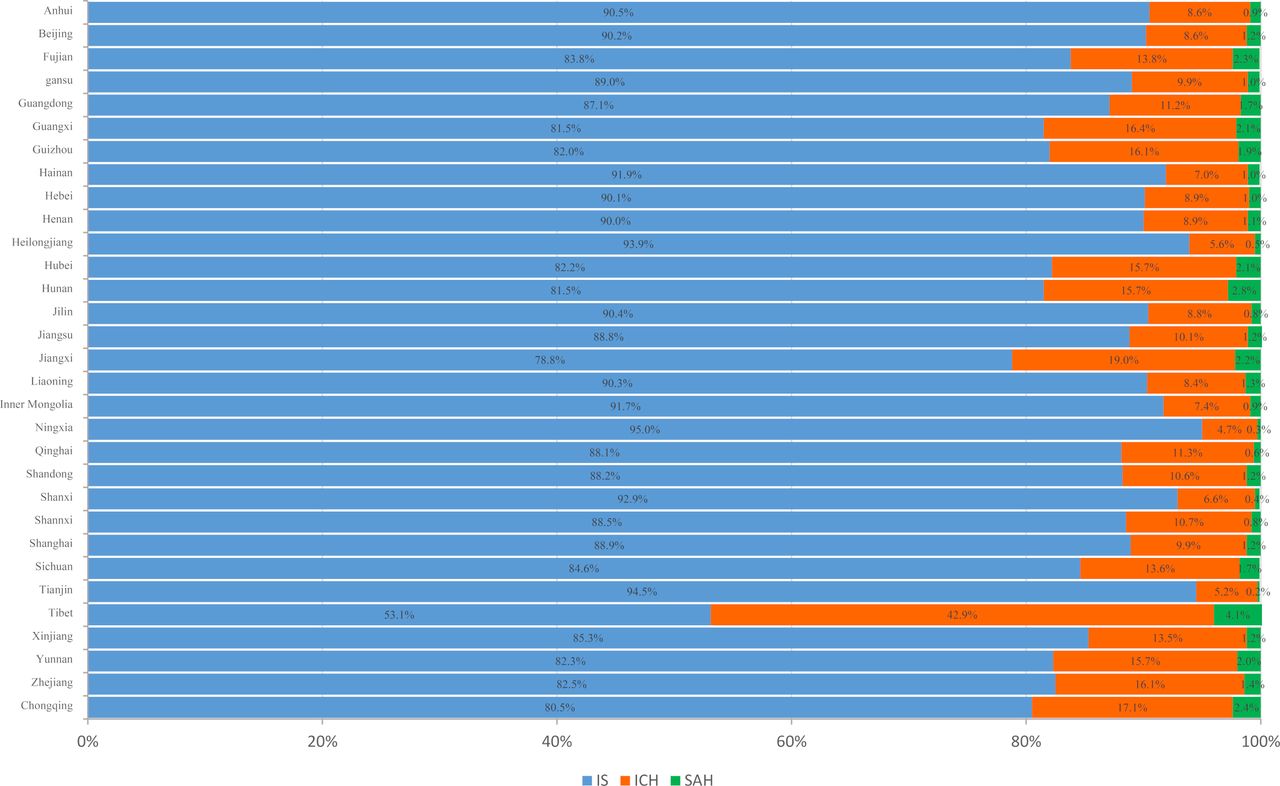
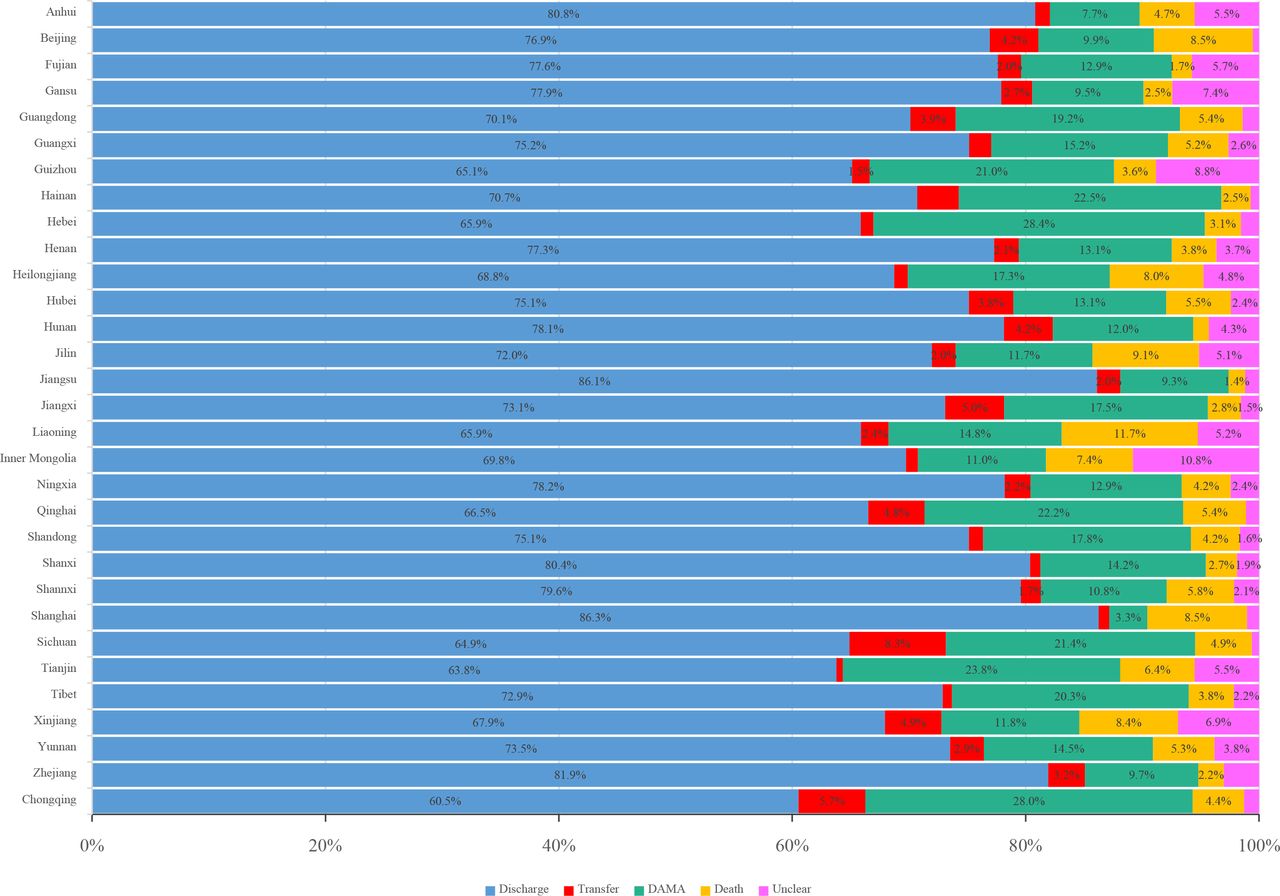
The proportion of each stroke subtype varied by province. Tibet had the highest proportion of ICH (49.5% for tertiary public hospitals and 42.9% for secondary public hospitals/private hospitals), followed by Qinghai (27.1%) and Guizhou (23.1%) for tertiary public hospitals and by Jiangxi (19.0%) and Chongqing (17.1%) for secondary public hospitals/private hospitals (figures 11–12).

Proportion of stroke type for stroke admitted to tertiary public hospitals in the Hospital Quality Monitoring System in 2019 stratified by province.
Proportion of stroke type for stroke admitted to secondary public hospitals/private hospitals in the Hospital Quality Monitoring System in 2019 stratified by province.
Age distribution stratified by sex and stroke subtype
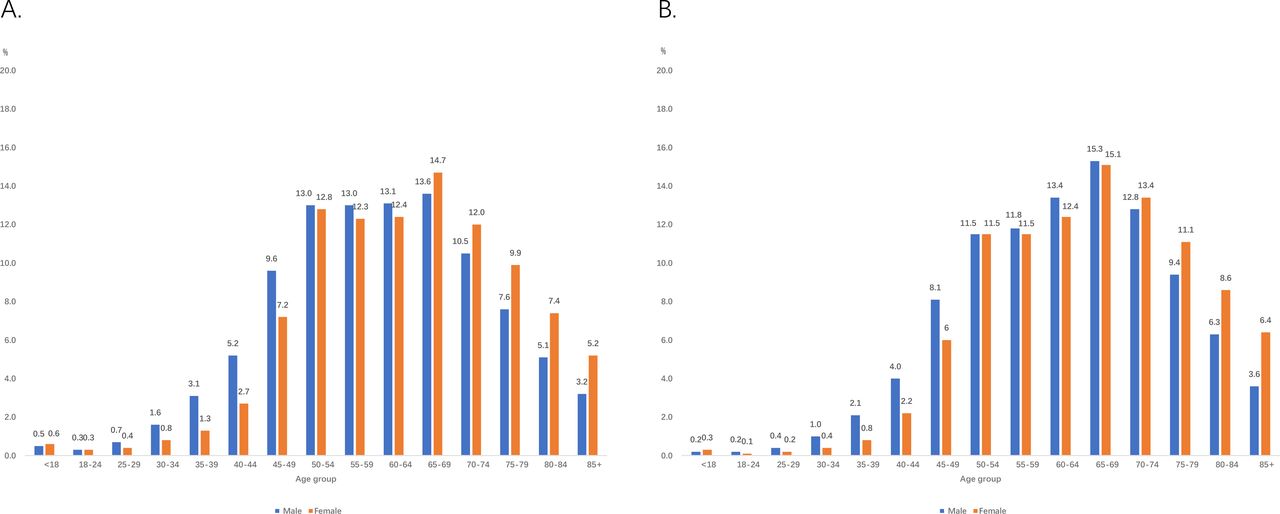
The proportions of strokes under 18 years of age were <0.1% for IS, 0.5% for ICH and 1.2% for SAH in tertiary public hospitals and<0.1% for IS, 0.2% for ICH and 2.3% for SAH in secondary public hospitals/private hospitals. For both tertiary and secondary public hospitals/private hospitals, male cases tended to have higher proportions of strokes in younger age groups (figures 13–15).
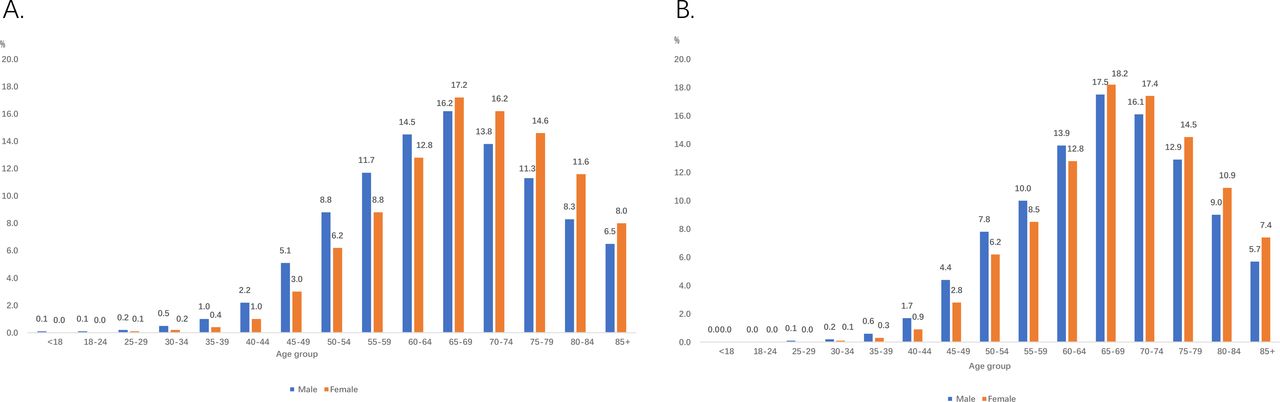
Age distribution for ischaemic stroke admitted to hospitals in the Hospital Quality Monitoring System in 2019. A. Tertiary public hospitals; B. Secondary public hospitals/private hospitals.

Age distribution for intracerebral haemorrhage stroke admitted to hospitals in the Hospital Quality Monitoring System in 2019. A. Tertiary public hospitals; B. Secondary public hospitals/private hospitals.
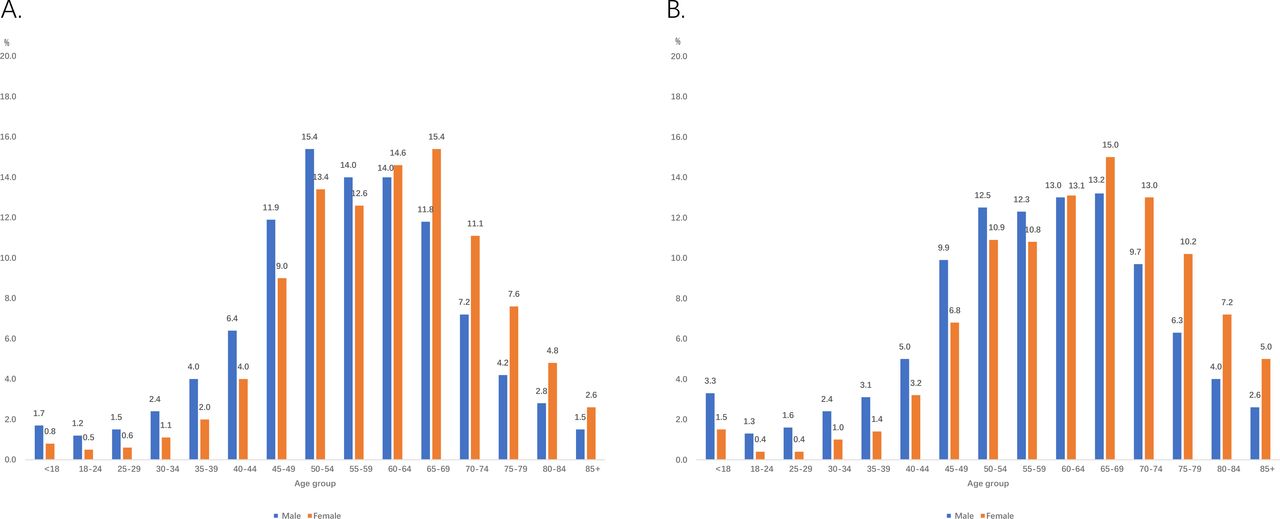
Age distribution for subarachnoid haemorrhage stroke admitted to hospitals in the Hospital Quality Monitoring System in 2019. A. Tertiary public hospitals; B. Secondary public hospitals/private hospitals.
Risk factors or comorbidities
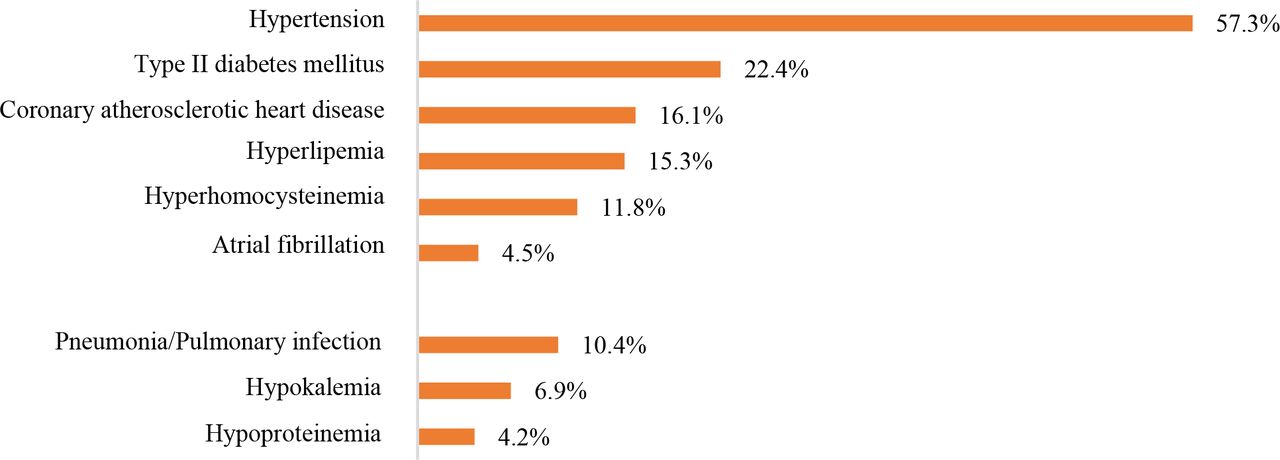
For cases admitted to tertiary public hospitals, the leading risk factor for stroke was hypertension, which was present in 1 614 477 (57.3%) IS cases, 339 210 (69.9%) ICH cases and 47 109 (44.1%) SAH cases. The leading comorbidity was pneumonia or pulmonary infection, which was present in 294 537 (10.4%) IS cases, 168 132 (34.6%) ICH cases and 31 675 (29.7%) SAH cases. Other risk factors and comorbidities are shown in figures 16–18.

Risk factors or comorbidities for ischaemic stroke admitted to tertiary public hospitals in the Hospital Quality Monitoring System in 2019.

Risk factors or comorbidities for intracerebral haemorrhage stroke admitted to tertiary public hospitals in the Hospital Quality Monitoring System in 2019.

Risk factors or comorbidities for subarachnoid haemorrhage stroke admitted to tertiary public hospitals in the Hospital Quality Monitoring System in 2019.
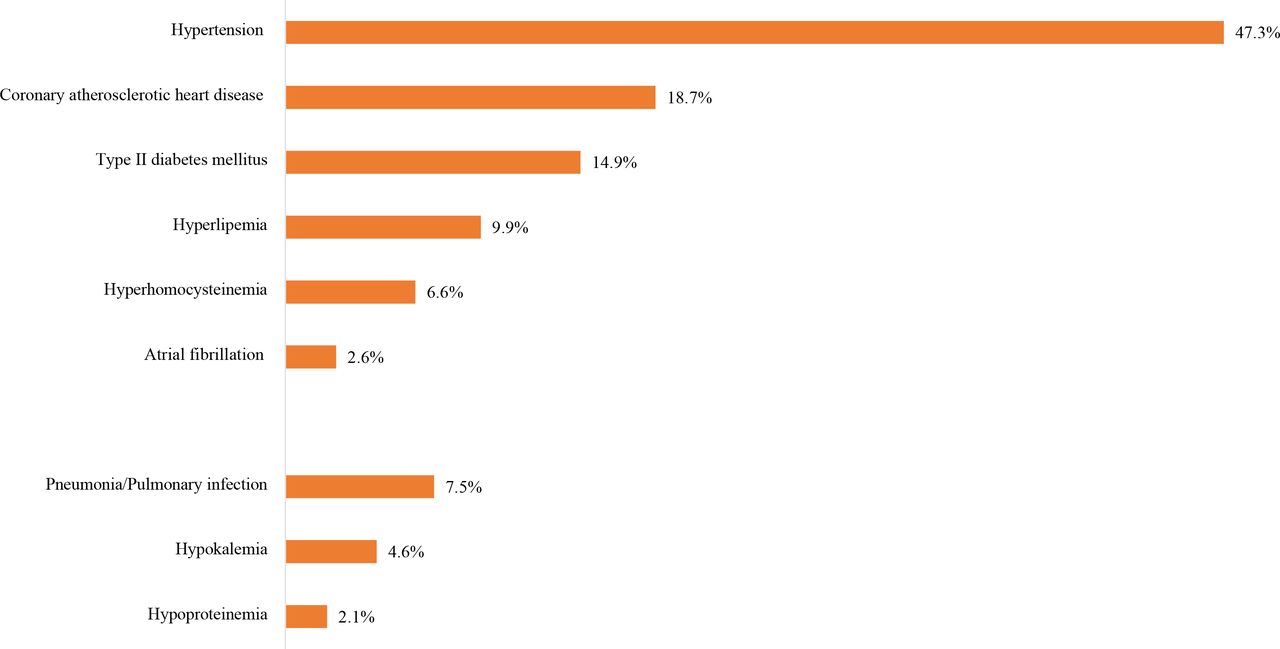
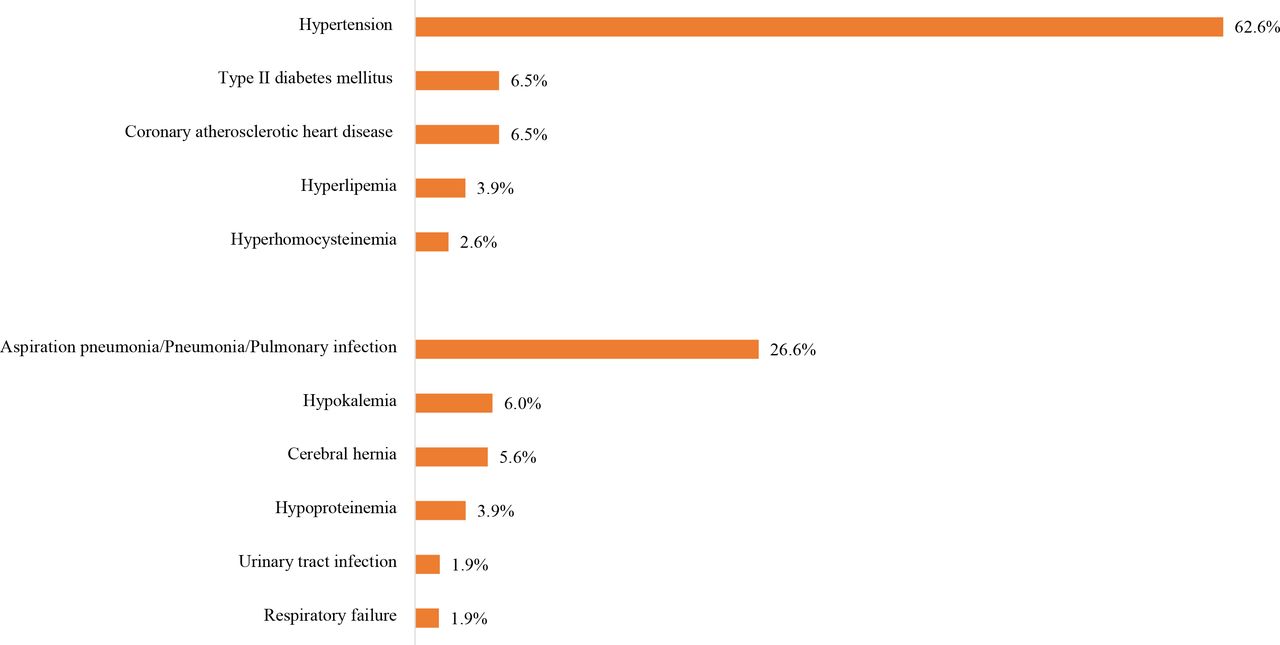
Cases admitted to secondary public hospitals/private hospitals shown similar patterns. The leading risk factor for stroke was also hypertension, which was present in 1 313 085 (47.3%) IS cases, 210 780 (62.6%) ICH cases and 15 900 (39.7%) SAH cases. The leading comorbidity was pneumonia or pulmonary infection, which was present in 208 296 (7.5%) IS cases, 89 629 (26.6%) ICH cases and 7322 (18.3%) SAH cases. Other risk factors and comorbidities are shown in figures 19–21.

Risk factors or comorbidities for ischaemic stroke admitted to secondary public hospitals/private hospitals in the Hospital Quality Monitoring System in 2019.

Risk factors or comorbidities for intracerebral haemorrhage stroke admitted to secondary public hospitals/private hospitals in the Hospital Quality Monitoring System in 2019.

Risk factors or comorbidities for subarachnoid haemorrhage stroke admitted to secondary public hospitals/private hospitals in the Hospital Quality Monitoring System in 2019.
In-hospital management
Key performance indicator
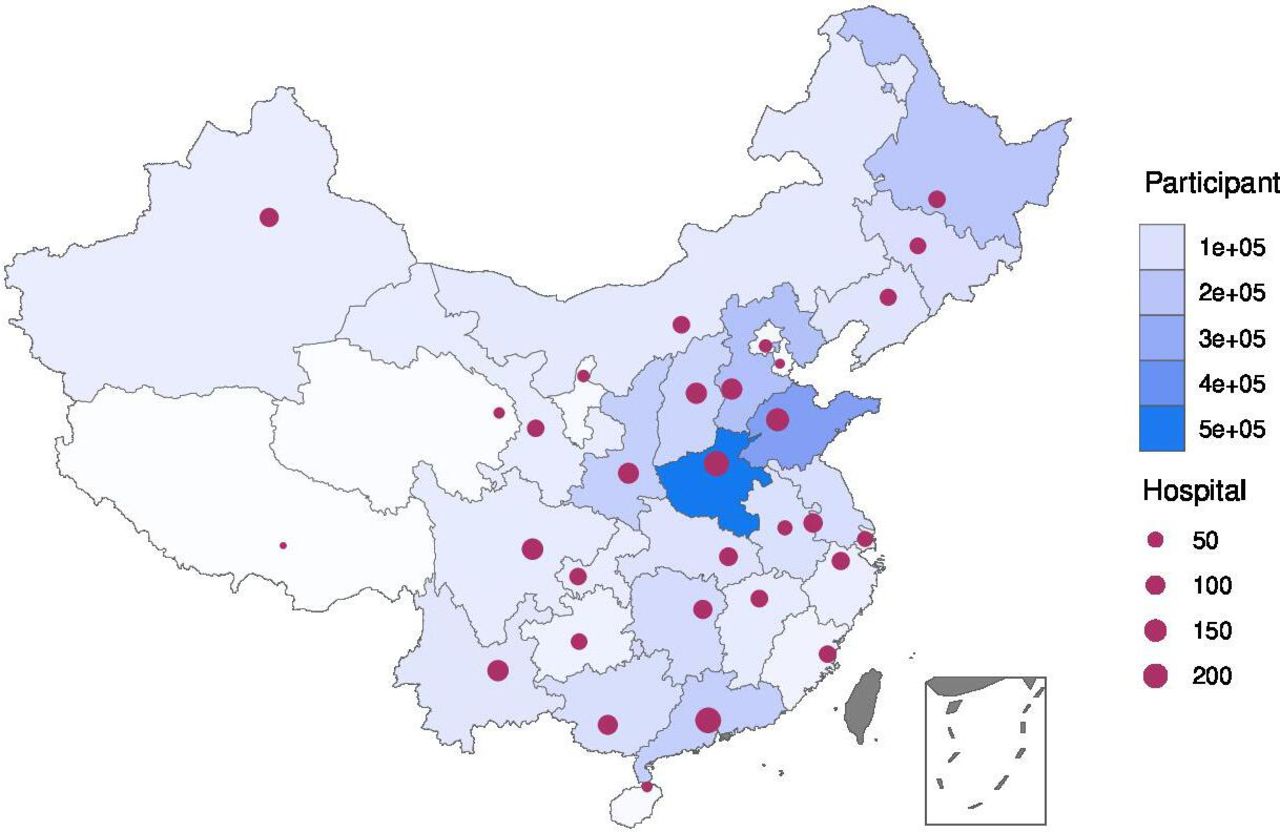
We first assessed key performance indicators based on the national guidelines using the CSCA data from 2019. A total of 323 601 strokes (294 573 IS, 26 026 ICH, and 3002 SAH) from 1337 hospitals were analysed (figure 22). The composite scores for IS, ICH, and SAH were 0.78±0.20, 0.69±0.27 and 0.60±0.31, respectively. The all-or-none measures for IS, ICH and SAH were 25.5% (25.4%–25.7%), 29.1% (28.5%–29.6%) and 23.7% (22.2%–25.2%), respectively. Other indicators in total and by sex are shown in tables 9–11.
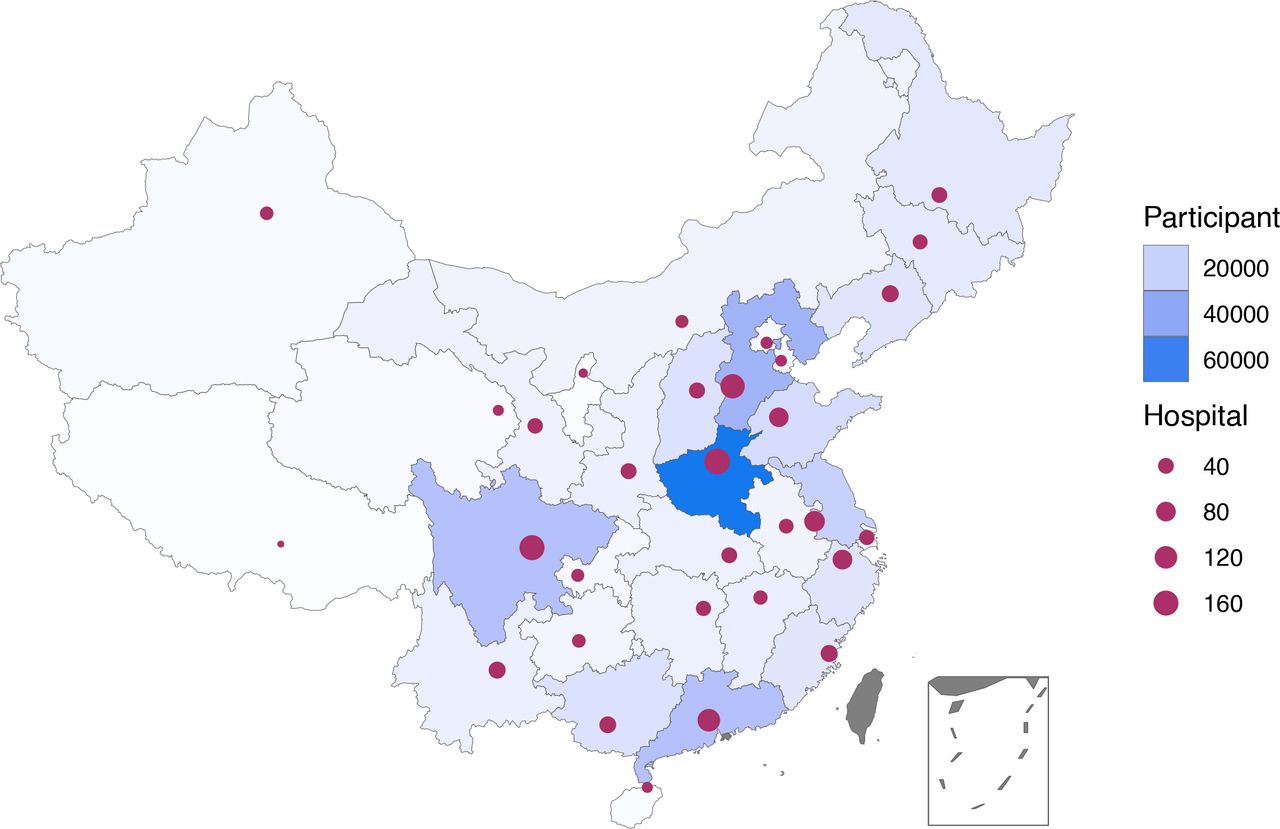
Distribution of hospitals and participants from Chinese Stroke Center Alliance in 2019.
Key performance indicators of ischaemic stroke from Chinese Stroke Center Alliance in 2019
Key performance indicators of intracerebral haemorrhage from Chinese Stroke Center Alliance in 2019
Key performance indicators of subarachnoid haemorrhage from Chinese Stroke Center Alliance in 2019
Procedures and operations
We also evaluated procedures and operations using the HQMS 2019 data. Generally, cases admitted to tertiary public hospitals received more common procedures or interventions than their counterparts admitted to secondary public hospitals/private hospitals. The most common procedures for IS was intracranial intra-arterial thrombectomy (15 602 (55.4‱) and 1022 (3.7‱) for patients admitted to tertiary public hospitals and secondary public hospitals/private hospitals, respectively) and carotid artery stenting (7794 (27.7‱) and 457 (1.7‱) for cases admitted to tertiary public hospitals and secondary public hospitals/private hospitals, respectively) (figures 23 and 24).

Procedures for ischaemic stroke admitted to tertiary public hospitals in the Hospital Quality Monitoring System in 2019.

Procedures for ischaemic stroke admitted to secondary public hospitals/private hospitals in the Hospital Quality Monitoring System in 2019.
The most common procedures for ICH in HQMS were the evacuation of intracerebral haematoma/evacuation of intracranial haematoma/transtemporal evacuation of intracerebral haematoma (50 191 (10.3%) and 17 539 (5.2%) for cases admitted to tertiary public hospitals and secondary public hospitals/private hospitals, respectively) and burr-hole drainage of ventricle/burr-hole decompression of skull (22 007 (4.5%) and 9812 (2.9%) for cases admitted to tertiary public hospitals and secondary public hospitals/private hospitals, respectively) (figures 25 and 26).

Procedures for intracerebral haemorrhage stroke admitted to tertiary public hospitals in the Hospital Quality Monitoring System in 2019.

Procedures for intracerebral haemorrhage stroke admitted to secondary public hospitals/private hospitals in the Hospital Quality Monitoring System in 2019.
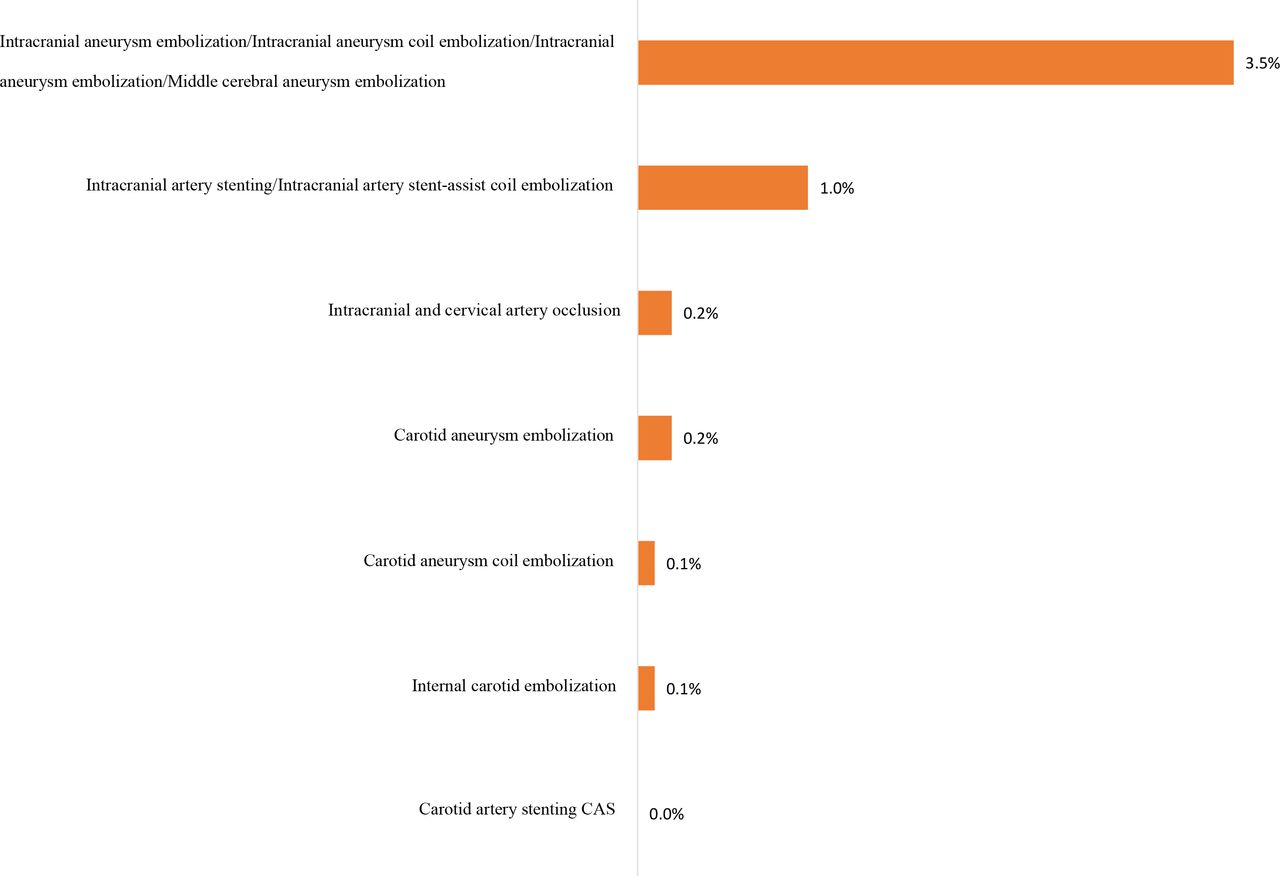
For SAH in HQMS, the most common interventions were intracranial aneurysm embolisation/intracranial aneurysm coil embolisation/intracranial aneurysm embolisation/middle cerebral aneurysm embolisation (19 386 (18.1%) and 1394 (3.5%) for cases admitted to tertiary public hospitals and secondary public hospitals/private hospitals, respectively) and intracranial arterial stenting/intracranial arterial stent-assist coil embolisation (5845 (5.5%) and 408 (1.0%) for cases admitted to tertiary public hospitals and secondary public hospitals/private hospitals, respectively) (figures 27 and 28). The most common procedure for SAH in HQMS was the clipping of cerebral aneurysm (5171 (4.8%) and 528 (1.3%) for cases admitted to tertiary public hospitals and secondary public hospitals/private hospitals, respectively) (figures 29 and 30). Prevalence of other procedures and interventions are shown in figures 23–30.

Interventions for subarachnoid haemorrhage stroke admitted to tertiary public hospitals in the Hospital Quality Monitoring System in 2019.

Interventions for subarachnoid haemorrhage stroke admitted to secondary public hospitals/private hospitals in the Hospital Quality Monitoring System in 2019.
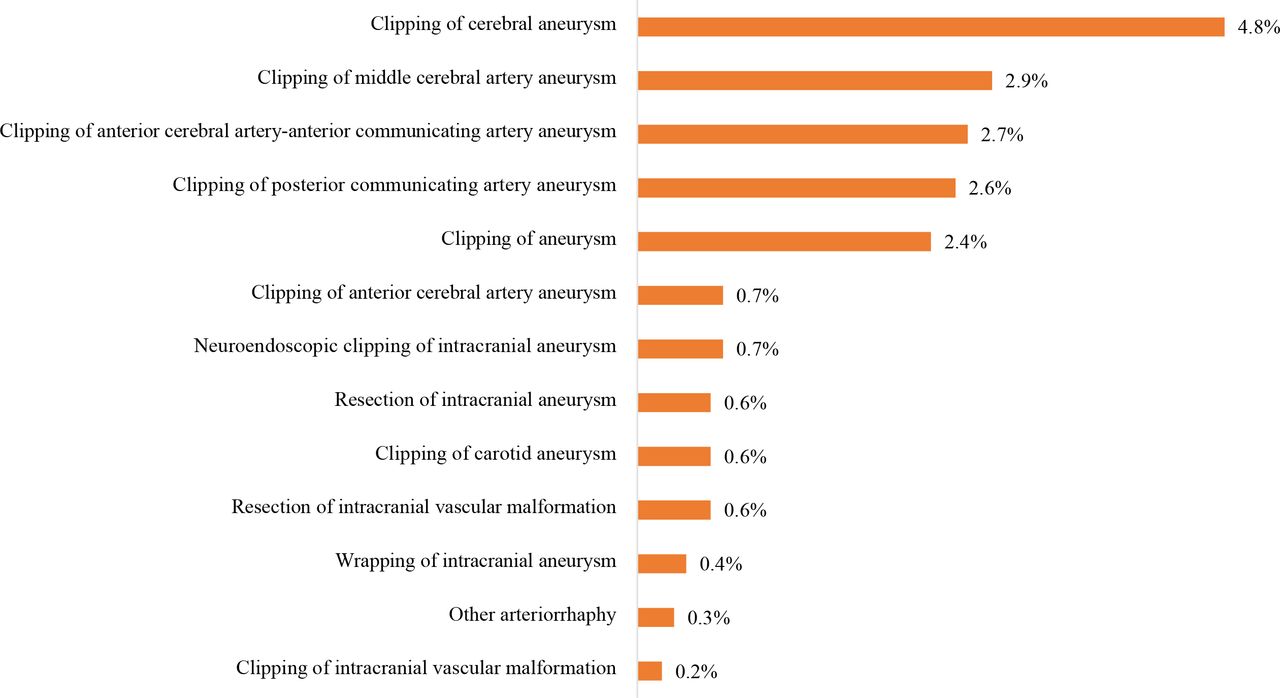
Procedures for subarachnoid haemorrhage stroke admitted to tertiary public hospitals in the Hospital Quality Monitoring System in 2019.
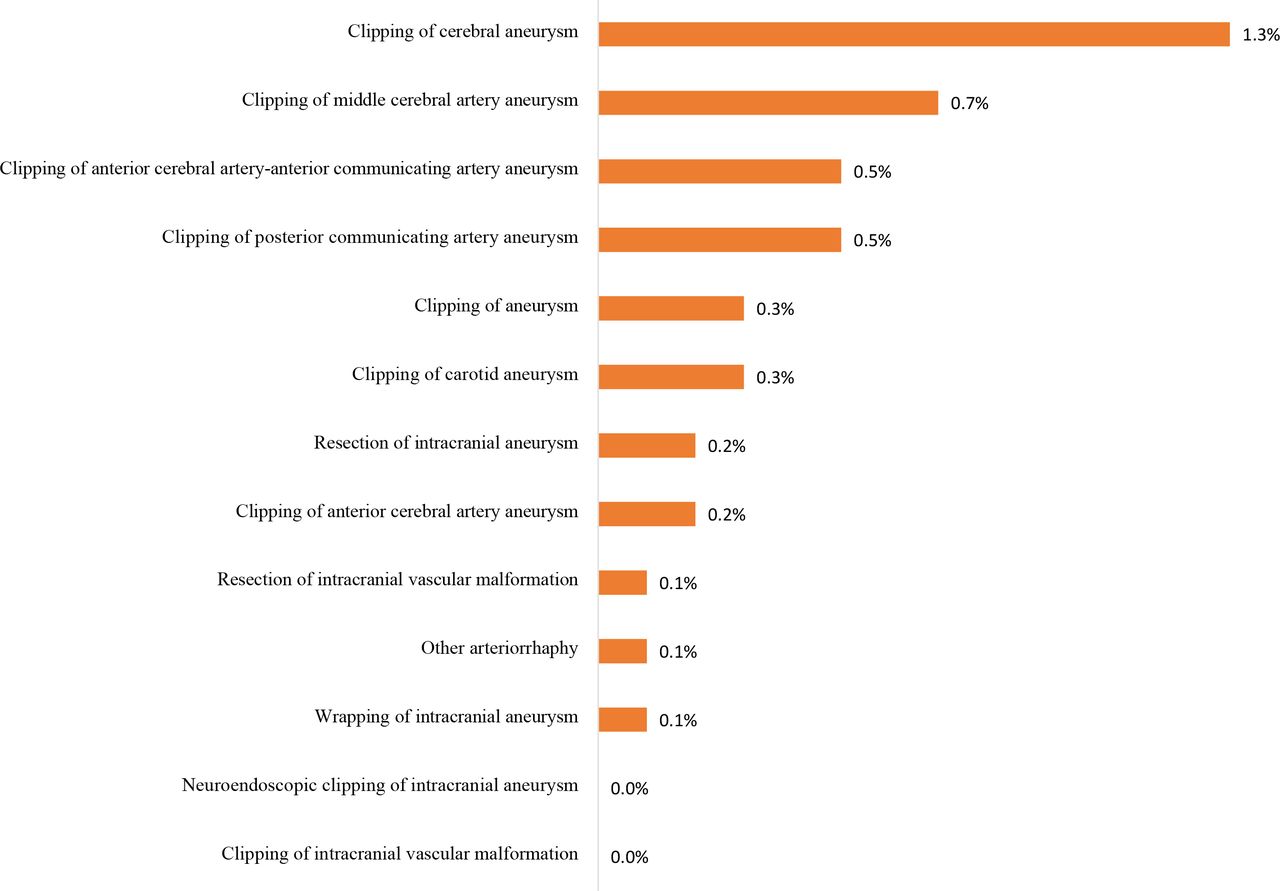
Procedures for subarachnoid haemorrhage stroke admitted to secondary public hospitals/private hospitals in the Hospital Quality Monitoring System in 2019.
In-hospital outcomes
Overall
About 88% of hospitalised stroke were discharged as planned (2 969 963 (87.1%) and 2 795 700 (88.6%) for cases admitted to tertiary public hospitals and secondary public hospitals/private hospitals, respectively). However, 290 394 (8.5%) and 216 801 (6.9%) cases were DAMA or died during hospitalisation for tertiary public hospitals and secondary public hospitals/private hospitals, respectively. The mean length of stay was 11.0±9.2 days and 9.7±8.1 days, with median (IQR) 9.0 (6.0–13.0) and 8.0 (6.0–12.0) days for cases admitted to tertiary public hospitals and secondary public hospitals/private hospitals, respectively. The average fee for the care of one patient with stroke was about ¥16 767 and ¥8096, and the average out-of-pocket spending was about ¥5342 and ¥2397 for cases admitted to tertiary public and secondary public hospitals/private hospitals, respectively. Compared with ISs, haemorrhagic strokes had much higher rate of DAMA/death (≈20% vs ≈6%), longer length of stay (≈ 15 days vs 10 days), and higher total fees and out-of-pocket spending (table 12).
In-hospital outcomes of stroke cases admitted to hospitals in the Hospital Quality Monitoring System in 2019
Special subgroups
Sex: Female cases had comparable discharge rates, DAMA/death rate and length of stay with male patients. However, female cases had lower cost of care for IS and ICH but higher cost of care for SAH compared with male cases (tables 13–15).
In-hospital outcomes of ischaemic stroke cases admitted to hospitals in the Hospital Quality Monitoring System in 2019 by sex
In-hospital outcomes of intracerebral haemorrhage cases admitted to hospitals in the Hospital Quality Monitoring System in 2019 by sex
In-hospital outcomes of subarachnoid haemorhage cases admitted to hospitals in the Hospital Quality Monitoring System in 2019 by sex
Stroke subtypes and insurance status: Stroke cases covered by URBMI had the lowest DAMA rate (3.5% and 3.9% for tertiary public hospitals and secondary public hospitals/private hospitals, respectively) and the highest in-hospital death rate (1.0% and 0.6% for tertiary public hospitals and secondary public hospitals/private hospitals, respectively), while cases covered by NRCMS had the lowest in-hospital death rate (0.3% and 0.2% for tertiary public hospitals and secondary public hospitals/private hospitals, respectively). Cases with self-pay insurance type had the highest DAMA rate for IS (7.2% and 6.3% for tertiary public hospitals and secondary public hospitals/private hospitals, respectively) and ICH (17.7% and 17.2% for tertiary public hospitals and secondary public hospitals/private hospitals, respectively), while for SAH, cases covered by UEBMI had the highest DAMA rate (18.5% and 19.3% for tertiary public hospitals and secondary public hospitals/private hospitals, respectively). Other in-hospital outcomes such as length of stay, total fees and out-of-pocket spending are shown in tables 16–21.
In-hospital outcomes of ischaemic stroke cases admitted to tertiary public hospitals in the Hospital Quality Monitoring System in 2019 by insurance
In-hospital outcomes of ischaemic stroke cases admitted to secondary public hospitals/private hospitals in the Hospital Quality Monitoring System in 2019 by insurance
In-hospital outcomes of intracerebral haemorrage cases admitted to tertiary public hospitals in the Hospital Quality Monitoring System in 2019 by insurance
In-hospital outcomes of intracerebral haemorrage cases admitted to secondary public hospitals/private hospitals in the Hospital Quality Monitoring System in 2019 by insurance
In-hospital outcomes of subarachnoid haemorrhage cases admitted to tertiary public hospitals in the Hospital Quality Monitoring System in 2019 by insurance
In-hospital outcomes of subarachnoid haemorrhage cases admitted to secondary public hospitals/private hospitals in the Hospital Quality Monitoring System in 2019 by insurance
Day of admission (weekday vs weekend): Generally, patients admitted on weekdays had lower DAMA/death rate and lower total costs than those admitted on weekends, especially for patients with IS admitted to tertiary public hospitals (tables 22–24).
In-hospital outcomes of ischaemic stroke cases admitted to hospitals in the Hospital Quality Monitoring System in 2019 by admission day
In-hospital outcomes of intracerebral haemorrhage cases admitted to hospitals in the Hospital Quality Monitoring System in 2019 by admission day
In-hospital outcomes of subarachnoid haemorrhage cases admitted to hospitals in the Hospital Quality Monitoring System in 2019 by admission day
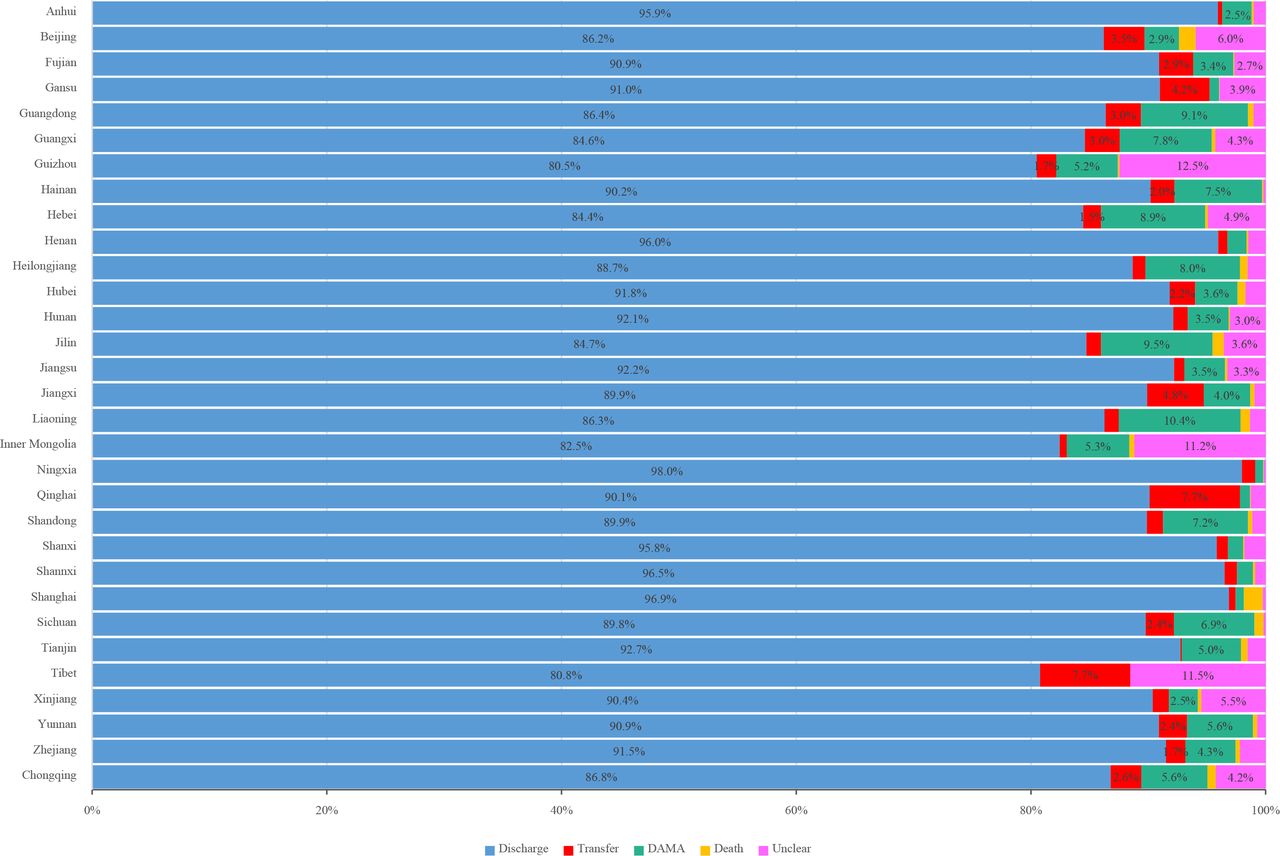
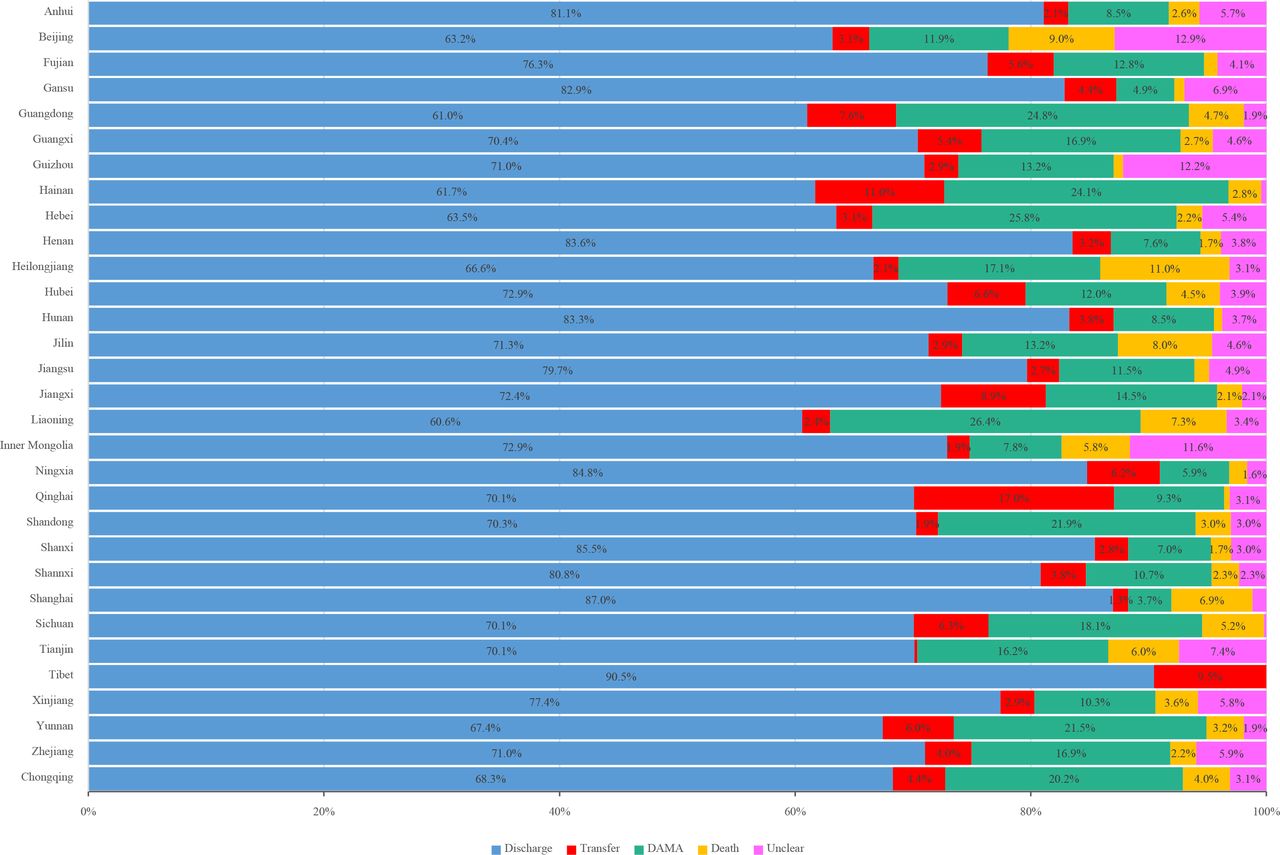
Provinces and stroke subtypes: Results showed that Tianjin, Chongqing and Hebei had the highest DAMA rates, while Shanghai had the highest rate of in-hospital deaths among IS patients; Hebei and Chongqing had the highest DAMA rates, while Liaoning had the highest rate of in-hospital deaths among ICH or SAH patients (figures 31–33).

In-hospital outcomes of ischaemic stroke admitted to tertiary public hospitals in the Hospital Quality Monitoring System in 2019 by province, autonomous region, or municipality. DAMA, discharge against medical advice.

In-hospital outcomes of intracerebral haemorrhage stroke admitted to tertiary public hospitals in the Hospital Quality Monitoring System in 2019 by province, autonomous region or municipality. DAMA, discharge against medical advice.

In-hospital outcomes of subarachnoid haemorrhage stroke admitted to tertiary public hospitals in the Hospital Quality Monitoring System in 2019 by province, autonomous region or municipality. DAMA, discharge without medical advice.
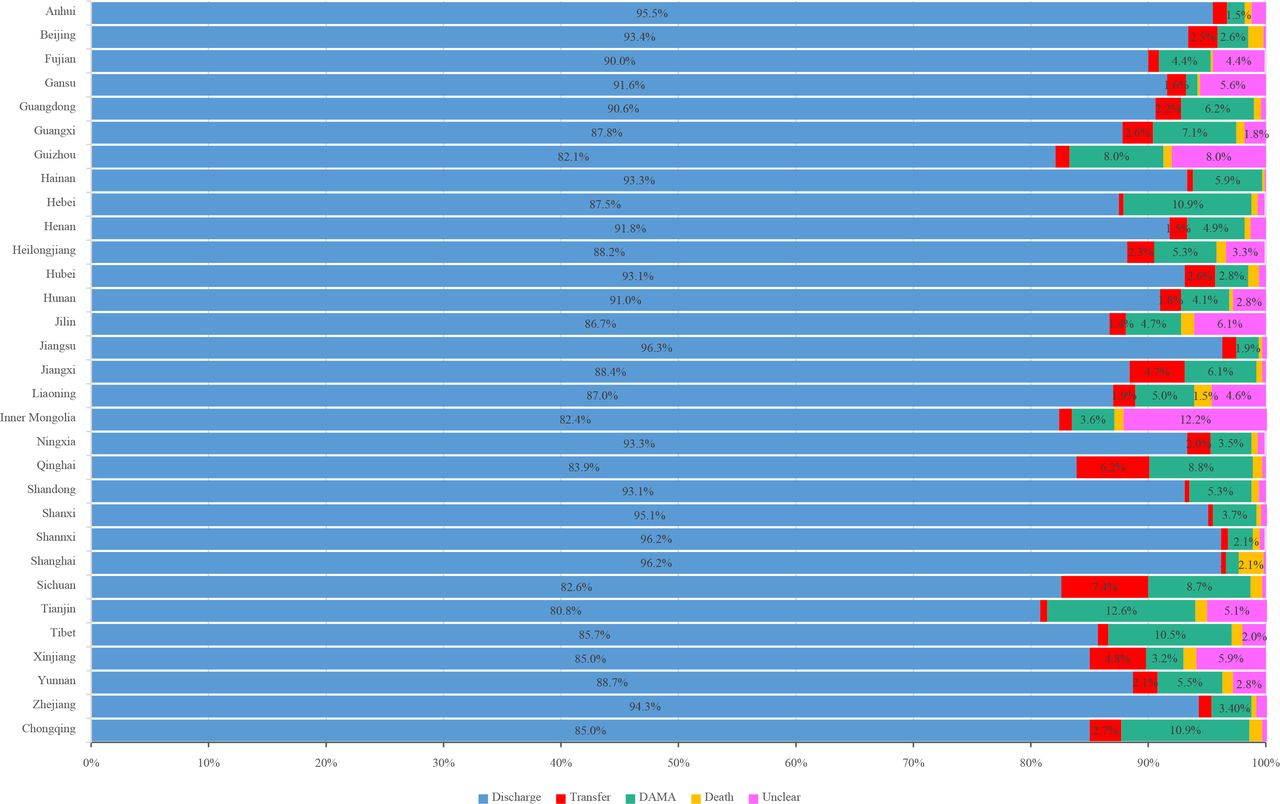
Results from secondary public hospitals/private hospitals in the HQMS showed that Liaoning and Jilin had the highest DAMA rates, while Shanghai had the highest rate of in-hospital deaths among IS patients; Liaoning and Hebei had the highest DAMA rates, while Heilongjiang had the highest rate of in-hospital deaths among ICH patients. Tianjin and Hainan had the highest DAMA rates, while Tianjin had the highest rate of in-hospital deaths among SAH patients (figures 34–36).
In-hospital outcomes of ischaemic stroke admitted to secondary public hospitals/private hospitals in the Hospital Quality Monitoring System in 2019 by province, autonomous region or municipality. DAMA, discharge against medical advice.
In-hospital outcomes of intracerebral haemorrhage stroke admitted to secondary public hospitals/private hospitals in the Hospital Quality Monitoring System in 2019 by province, autonomous region, or municipality. DAMA, discharge against medical advice.

In-hospital outcomes of subarachnoid haemorrhage stroke admitted to secondary public hospitals/private hospitals in the Hospital Quality Monitoring System in 2019 by province, autonomous region or municipality. DAMA, discharge without medical advice.
Interprovincial admission
Interprovincial admission to other provinces
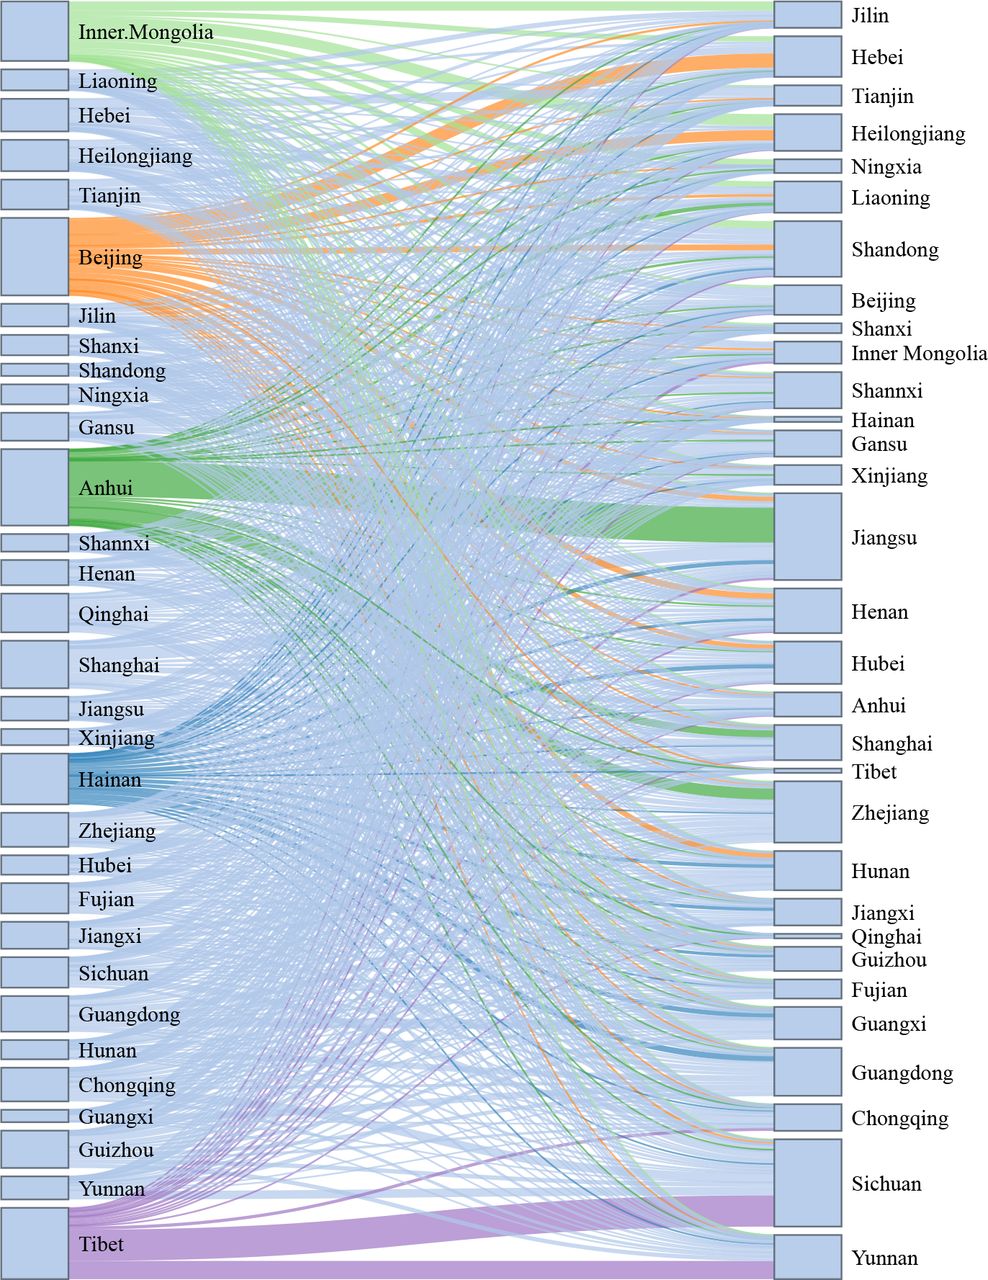
The largest proportion of interprovincial admission to other provinces for IS was seen in Tibet (31.4%), followed by Qinghai (10.4%), Beijing (9.8%), Inner Mongolia (9.3%) and Anhui (6.4%). Interprovincial admission for IS resident in Tibet and Qinghai were largely admitted to hospitals in Sichuan. For those residents in Beijing, Inner Mongolia and Anhui were largely admitted to hospitals in Hebei, Jilin, and Jiangsu, respectively (figure 37).

Interprovincial admission to other provinces for ischaemic stroke in the Hospital Quality Monitoring System in 2019.
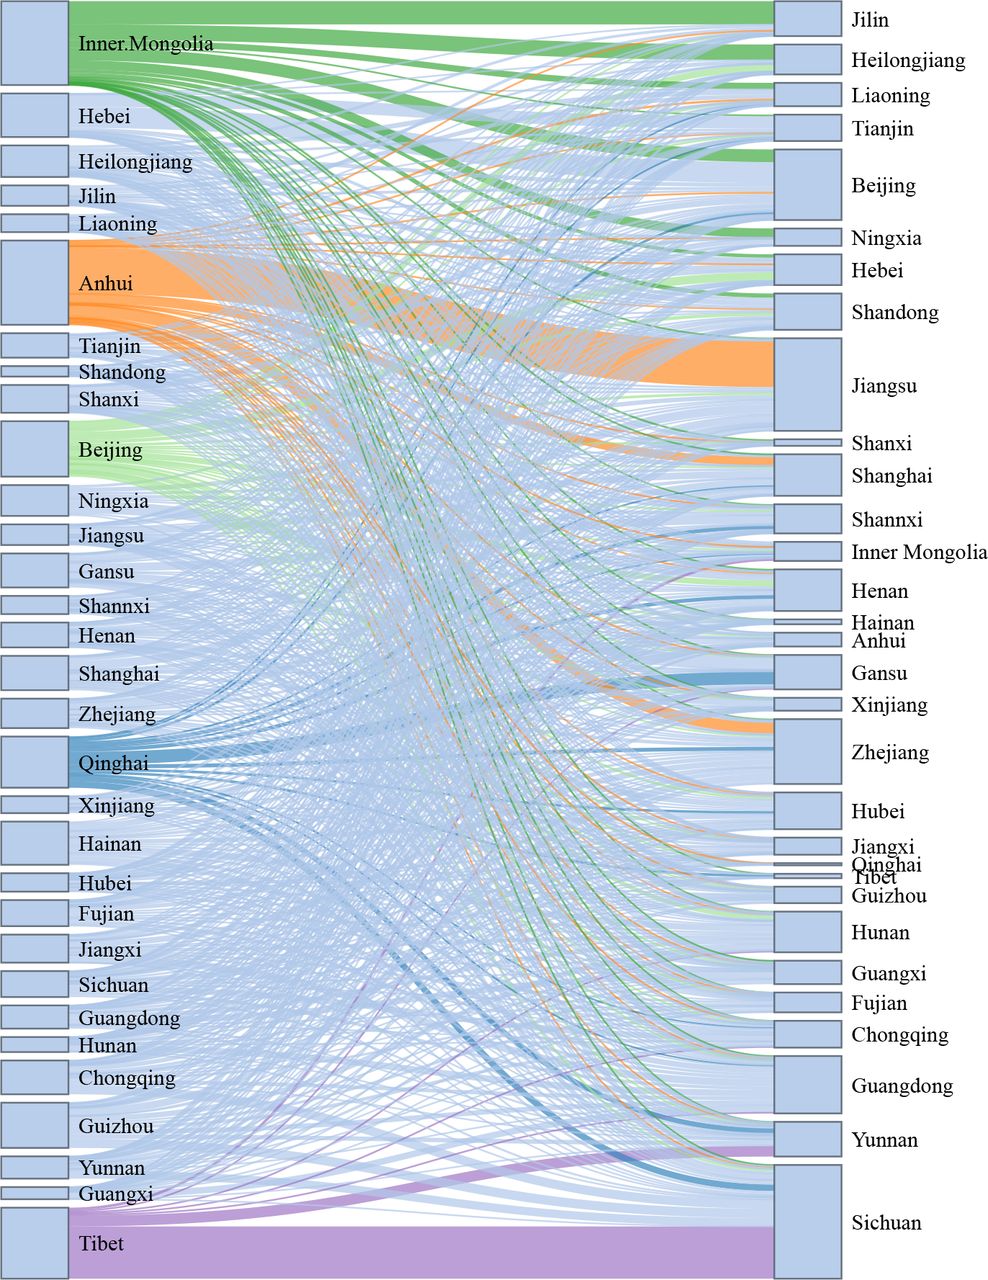
The largest proportion of interprovincial admission to other provinces for ICH was seen in Beijing (14.8%), followed by Anhui (14.7%), Tibet (13.7%), Inner Mongolia (11.4%) and Hainan (9.7%). Interprovincial admission for ICH resident in Beijing and Anhui were largely admitted to hospitals in Hebei and Jiangsu, while those resident in Tibet were largely admitted to hospitals in Sichuan and Yunnan (figure 38).

Interprovincial admission to other provinces for intracerebral haemorrhage stroke in the Hospital Quality Monitoring System in 2019.
For SAH, Anhui (20.6%) had the largest proportion of interprovincial admission to other provinces, followed by Inner Mongolia (20.5%), Tibet (17.4%), Beijing (13.6%) and Qinghai (12.5%). Similarly, interprovincial admission for SAH resident in Anhui, Inner Mongolia and Tibet were largely admitted to hospitals in Jiangsu, Jilin and Sichuan, respectively (figure 39).

Interprovincial admission to other provinces for subarachnoid haemorrhage stroke in the Hospital Quality Monitoring System in 2019.
Interprovincial admission from other provinces
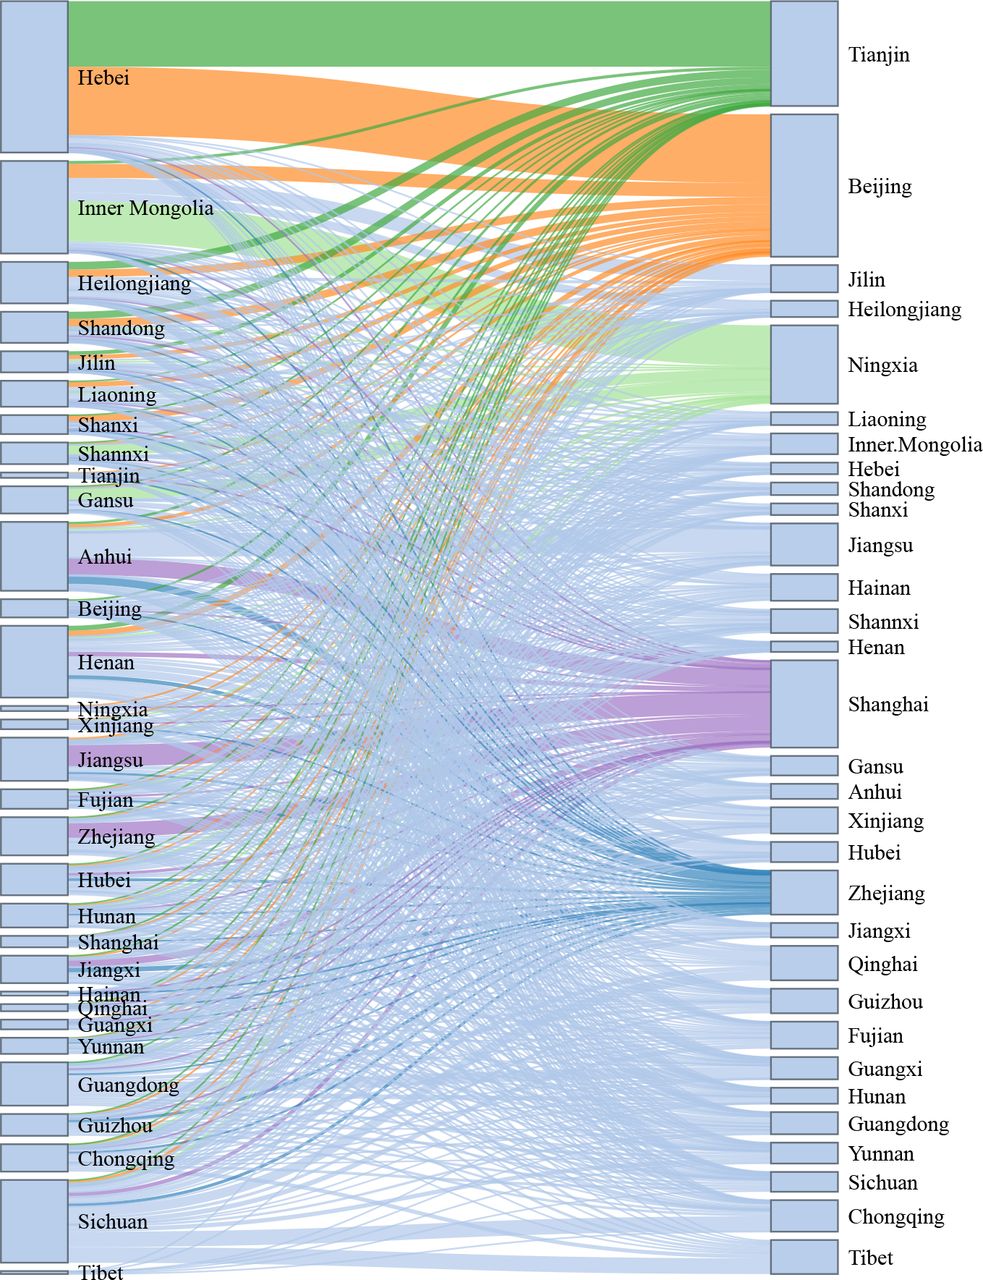
The largest proportion of interprovincial admission from other provinces for IS was seen in Tibet (13.6%), followed by Tianjin (11.4%), Beijing (10.7%), Shanghai (7.4%) and Ningxia (7.1%). Interprovincial admission for IS admitted to hospitals in Tibet, Tianjin, Beijing and Ningxia were largely from patients resident in Sichuan, Hebei, Hebei and Inner Mongolia, respectively (figure 40).

Interprovincial admission from other provinces for ischaemic stroke in the Hospital Quality Monitoring System in 2019.
The largest proportion of interprovincial admission from other provinces for ICH was seen in Beijing (21.4%), followed by Tianjin (20.0%), Shanghai (17.5%), Tibet (16.3%) and Ningxia (15.2%). Interprovincial admission for ICH admitted to hospitals in Tianjin, Beijing, Ningxia and Tibet were largely from patients resident in Hebei, Hebei, Inner Mongolia and Sichuan, respectively (figure 41).

Interprovincial admission from other provinces for intracerebral haemorrhage stroke in the Hospital Quality Monitoring System in 2019.
For SAH, Beijing (39.2%) also had the largest proportion of interprovincial admission from other provinces, followed by Tianjin (28.9%), Shanghai (24.0%), Ningxia (21.6%) and Zhejiang (12.2%). Similarly, interprovincial admission for SAH admitted to hospitals in Tianjin, Beijing and Ningxia was largely from patients resident in Hebei, Hebei, and Inner Mongolia, respectively. However, interprovincial admission Shanghai was largely from Jiangsu, Anhui and Zhejiang (figure 42).

Interprovincial admission from other provinces for subarachnoid haemorrhage stroke in the Hospital Quality Monitoring System in 2019.
Discussion
The crude death rate from stroke has been increasing rapidly in China over the past three decades, rising at a faster rate than that of other countries. Ageing has become one of the major contributors to the increased mortality from stroke. In 2019, 12.6% of China’s population was over 65 years of age.17 The age-adjusted, standardised death rate has fallen, but the absolute number of death caused by stroke still increases each year. China faces increasing challenges to reduce morbidity, mortality and disease burden from stroke in the coming years.
Risk factor control and continued investment in public health projects have helped reduce the stroke burden in the USA over the past 100 years.18 Conversely, risk factors are highly prevalent among patients with stroke in China; furthermore, the prevalence of major risk factors for stroke in the general population in China has increased nearly 20 years. For example, the age-standardised overweight prevalence rose from 24.0% to 34.4% and obesity prevalence increased from 7.1% to 16.8% between 2004 and 2018; and the prevalence of hypertension increased from 18.6% in 2002 to 27.5% in 2018. The Chinese government has implemented several public education and primary prevention initiatives for stroke, with some success. From 2002 to 2012, the awareness rate, treatment rate and control rate of hypertension improved by 16.3%, 16.4% and 7.7%, respectively. The daily salt intake by Chinese adults≥18 years of age has decreased from 12.0 in 2002 to 9.3 g in 2018 during the same period, though this is still considered a high level.
In addition to stroke cases admitted to tertiary public hospitals, we also included stroke cases admitted to secondary public hospitals/private hospitals and expanded our analysis. The large scope of included hospital and stroke cases, and the comparability of characteristics of stroke cases from HQMS to previous reports,5 12 19 would improve the generality of results in this report. In addition, for the first time, we reported interprovincial admission based on province level data from HQMS, which may provide useful data on the resource allocation and policy development for reimbursement by medical insurance.
This report has several limitations. We used various sources of data, including but not limited to surveillance data, survey data, registry data and administrative data. These data vary in definition, form, quality and time of collection. Nevertheless, these are the best data available and have been carefully adjudicated. In addition, the representativeness of our data could not be guaranteed. For example, CSCA is based on hospitals’ voluntary enrolment and thus did not use a sampling process to obtain a nationally representative sample of hospitals. In HQMS, Tibet had only 2100 cases enrolled. Hence, these data should be interpreted with caution, particularly at the province level. The accuracy of patient identification lie in the accurate of ICD-10 coding. However, no audit or validation study has been reported. In addition, data were insufficient to identify therapeutic indications for procedures and operations. Therefore, we reported the rates of procedures and operations among the overall population, not the population with indications.
This report summarised the most up-to-date data on the characteristics, risk factors, admissions, geographical distribution, comorbidities, in-hospital management, outcomes and interprovincial admission for all subtypes of stroke cases in China. Information on inpatient stroke care was based on the data from HQMS and CSCA in 2019. Compared with previous registry data, the contemporary HQMS data has a remarkable advantage in its scope and sample sizes. This report provides a nationally representative and up-to-date evidence that will help guide the healthcare resource allocation and provide directions for future research in stroke care and prevention in China. Further efforts on comprehensive risk factor control such as obesity and hypertension, as well as specific in-hospital management measures, including acute reperfusion treatment, anticoagulation for AF and prevention of pneumonia or pulmonary infection, are needed in order to provide an overall stroke prevention and control in China.
Ethics statements
Patient consent for publication
Ethics approval
This study does not involve human participants.
Acknowledgments
We thank The National Health Commission of the People’s Republic of China and China Standard Medical Information Research Center for the support of this study. We thank CSCA collaborating centers, members and volunteers for their hard work and efforts. We thank every participant who has contributed important and invaluable data to CSCA.
References
Supplementary material
Supplementary Data
This web only file has been produced by the BMJ Publishing Group from an electronic file supplied by the author(s) and has not been edited for content.
Footnotes
Y-JW, Z-XL, H-QG and YZ are joint first authors.
Twitter @yilong
Y-JW, Z-XL, H-QG and YZ contributed equally.
Collaborators China Stroke Statistics Writing Committee (ordered alphabetically by First name): Beisha Tang (bstang7398@163. com, Department of Neurology, Xiangya Hospital, Central South University, Changsha, China), Caiyun Wang (wangcaiyun@chinastroke.net, Beijing Tiantan Hospital, Capital Medical University, Beijing, China), Chen Wang (wangchen-tr2002@163. com, Beijing Tiantan Hospital, Capital Medical University, Beijing, China), Bo Hu (hubo@hust.edu.cn, Department of Neurology, Union Hospital, Tongji Medical College, Huazhong University of Science and Technology (HUST), Wuhan, China), Chang Yin (yinchang@niha.org.cn, Dept of Healthcare Quality Monitoring and Control Research; National Institute of Hospital Administration, NHC; Beijing, China), Chuan-Qiang Pu(david.wang@chinastroke.net, Neurovascular Division, Department of Neurology, Barrow Neurological Institute, St. Joseph's Hospital and Medical Center, Phoenix, AZ 85013 USA), Dong-Shen Fan (dsfan@sina.com, Peking University Third Hospital), Dong Zhou (zhoudong66@yahoo.de, Department of Neurology, Huaxi Hospital of Sichuan University), Gang Zhao (zhaogang@fmmu.edu.cn, Department of Neurology, Xijing Hospital, The 4th Military Medical University, Xi’an, China), Hai-Bo Wang (Haibo@mail.harvard.edu, Clinical Trial Unit, First Affiliated Hospital of Sun Yat-Sen University), Hao Wang (Department of Neurosurgery, Beijing Tiantan Hospital, Capital Medical University, Beijing, China), Jing Wu (wujing@chinacdc.cn, National Center for Chronic and Non- communicable Disease Control and Prevention, Chinese Center for Disease Control and Prevention), Jin-Sheng Zeng (zengjs@pub.guangzhou.gd.cn, The First Affiliated Hospital of Zhongshan University), Lan-Xia Gan (lanxia.gan@cltr.org, China Standard Medical Information Research Center, Shenzhen, China), Li Guo (guoli6@163. com, Department of Neurology, The Second Hospital of Hebei Medical University, Shijiazhuang, China), Li- Min Wang (wanglimin@ncncd.chinacdc.cn, National Center for Chronic and Noncommunicable Disease Control and Prevention, Chinese Center for Disease Control and Prevention), Lin-Hong Wang (linhong@chinawch.org.cn, National Center for Chronic and Non- communicable Disease Control and Prevention, Chinese Center for Disease Control and Prevention), Li-Ying Cui (pumchcuily@sina.com, Peking Union Medical College Hospital), Mei-Jia Zhu (zhumeijia1818@163. com, Shandong Hospital of Thousand Buddha Mountain Affiliated to Shandong University), Ming Lou (loumingxc@vip.sina. com, Department of Neurology, The Second Affiliated Hospital of Zhejiang University School of Medicine), Ning Wang (nwang900@yahoo.com, Department of Neurology and Institute of Neurology, First Affiliated Hospital of Fujian Medical University, Fuzhou, China), Peng Xie (xiepeng@cqmu.edu.cn, Chongqing Medical University, Chongqing, China), Shuo Wang (captain9858@vip.sina. com, Department of Neurosurgery, Beijing Tiantan Hospital, Capital Medical University, Beijing, China), Tao Feng (happyft@sina. com, Department of Neurology, Beijing Tiantan Hospital, Capital Medical University, Beijing, China), Tong Zhang (zt61611@sohu.com, Capital Medical University School of Rehabilitation Medicine, China Rehabilitation Research Center, Beijing, China), Wen-Hua Zhao (zhaowh@chinacdc.cn, National Institute for Nutrition and Health, Chinese Center for Disease Control and Prevention), Xu-Dong Ma (13910092912@ 163.com, National Health Commission of The People's Republic of China), Xun-Ming Ji (robertjixm@hotmail.com/jixunming@vip.163.com, Department of Neurosurgery, Xuanwu Hospital, Capital University of Medicine, Beijing, China), Yi-Ming Deng (parkerdeng@163.com, Department of Interventional Neuroradiology, Beijing Tiantan Hospital, Capital Medical University), Yi Yang (doctoryangyi@163.com/doctor_ yangyi@hotmail.com, Department of Neurology, the First Hospital of Jilin University, Changchun, China), Ying Shi (ying.shi@cltr.org, China Standard Medical Information Research Center, Shenzhen, China), Yu-Ming Xu (13903711125@126.com/ xym13903711125@126. com, Department of Neurology, the First Affiliated Hospital of Zhengzhou University, Zhengzhou, China), Yu-Ping Wang (wangyuping01@sina.cn, Xuanwu Hospital of Capital Medical University), Zhong- Rong Miao (zhongrongm@163. com, Department of Interventional Neuroradiology, Beijing Tiantan Hospital, Capital Medical University, Beijing, China), Xiao-Yuan Niu (niuxiaoyuan1958@163. com, Department of Neurology, First Hospital of Shanxi Medical University, Taiyuan, China).
Contributors Y-JW, Z-XL, H-QG and YZ contributed equally to this work. J-ZZ, Y-JW, X-DM and Z-XL designed the protocol and framework and also participated in the revision. YZ drafted stroke burden and risk factors in general population related sections. H-QG drafted inpatient characteristics, in-hospital management and outcomes, and interprovincial admission related sections. H-QG and DW integrated all sections for the manuscript. H-QG and QZ performed the statistical analysis based on data from the Hospital Quality Monitoring System and Chinese Stroke Center Alliance project. XY, XM, JJ and C-JW collected the data. DW, Z-XL, QZ, LL, Y-LW, YJ, HL, JW and W-ZW critically reviewed and revised the manuscript for important intellectual content.
Funding This study was funded by Ministry of Science and Technology of the People’s Republic of China, National Key R&D Programme of China (2017YFC1310901, 2016YFC0901002, 2017YFC1307905, and 2015BAI12B00), the Youth Programme (QML20180501), National Natural Science Foundation of China (81801152) and Beijing Talents Project (2018000021223ZK03 and 2018A13).
Map disclaimer The inclusion of any map (including the depiction of any boundaries therein), or of any geographic or locational reference, does not imply the expression of any opinion whatsoever on the part of BMJ concerning the legal status of any country, territory, jurisdiction or area or of its authorities. Any such expression remains solely that of the relevant source and is not endorsed by BMJ. Maps are provided without any warranty of any kind, either express or implied.
Competing interests None declared.
Provenance and peer review Commissioned; externally peer reviewed.
Supplemental material This content has been supplied by the author(s). It has not been vetted by BMJ Publishing Group Limited (BMJ) and may not have been peer-reviewed. Any opinions or recommendations discussed are solely those of the author(s) and are not endorsed by BMJ. BMJ disclaims all liability and responsibility arising from any reliance placed on the content. Where the content includes any translated material, BMJ does not warrant the accuracy and reliability of the translations (including but not limited to local regulations, clinical guidelines, terminology, drug names and drug dosages), and is not responsible for any error and/or omissions arising from translation and adaptation or otherwise.