Article Text

Abstract
Objectives: Increased white matter (WM) lesions on magnetic resonance imaging (MRI) are associated with worse cognitive function in older people. Enlarged perivascular spaces (EPVS) commonly coexist with and share some risk factors for WM lesions but are not quantified in published scales. It is not known whether the extent of EPVS is also associated with cognitive function. We tested the hypothesis that more EPVS would be associated with worse cognitive function.
Methods: Ninety seven healthy men (65–70 years), not on medications, underwent MRI scanning and comprehensive cognitive testing. EPVS were quantified in both the basal ganglia/centrum semiovale and the hippocampus, and WM lesions were measured.
Results: Scores on published WM lesion rating scales intercorrelated highly significantly and positively (ρ = 0.61 to 0.91, p<0.0001). A summary (WML) factor derived from principal components analysis of the WM scales correlated with EPVS in the basal ganglia/centrum semiovale (ρ = 0.48, p<0.0001) but not in the hippocampus. EPVS scores in the basal ganglia/centrum semiovale correlated significantly and negatively with non-verbal reasoning (ρ = −0.21, p = 0.038) and general visuospatial ability (ρ = −0.22, p = 0.032), adjusted for prior intelligence. The WML factor correlated significantly and negatively with visuospatial ability, as previously reported, and showed an unexpected positive correlation with one test of verbal memory (list-learning).
Conclusions: These findings suggest that increased EPVS are correlated with worse cognitive function. Future studies examining changes in WM with ageing should consider incorporating measures of EPVS and examine the sequence of EPVS and WM lesion development over time. More work is needed to develop valid and reliable measures of EPVS.
- EPVS, enlarged perivascular spaces
- MRI, magnetic resonance imaging
- NART, National Adult Reading Test
- WM, white matter
- ageing
- cognition
- enlarged perivascular spaces
- neuroimaging
- white matter lesions
Statistics from Altmetric.com
- EPVS, enlarged perivascular spaces
- MRI, magnetic resonance imaging
- NART, National Adult Reading Test
- WM, white matter
Magnetic resonance imaging (MRI) studies have demonstrated that more white matter (WM) lesions are significantly associated with decrements in cognitive function with ageing.1 However, there remain substantial variations in how the extent and severity of WM lesions are determined.2
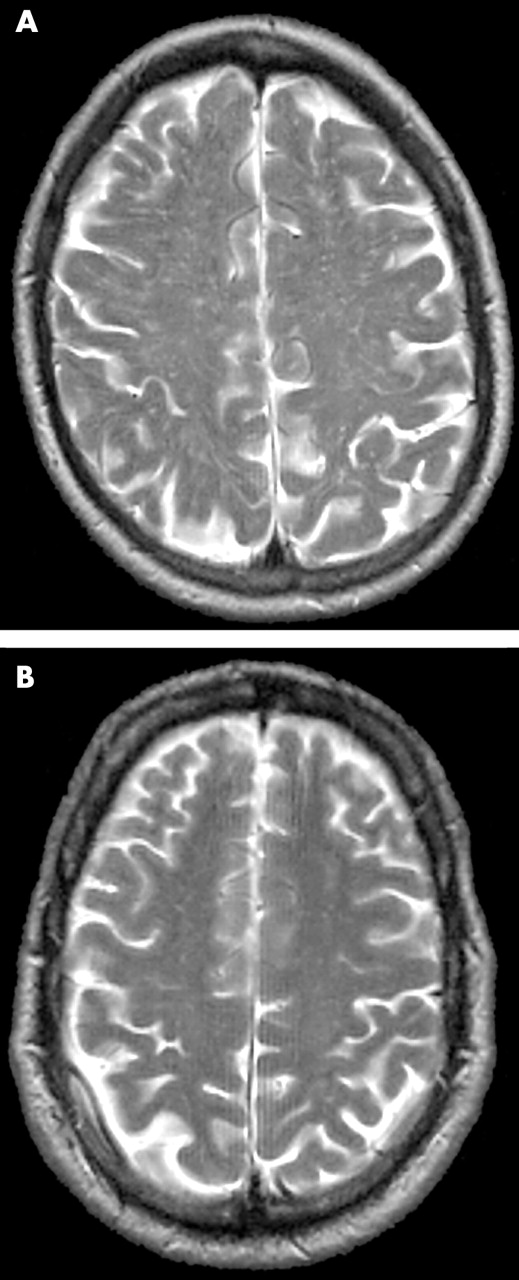
Enlarged perivascular spaces (EPVS), or Virchow–Robin spaces, appear as punctate or linear hyperintensities, isointense with cerebrospinal fluid (CSF) on T2-weighted images, in the centrum semiovale, basal ganglia, and the hippocampus. In some subjects they may be both numerous and widespread throughout the brain (fig 1). They are thought to correspond with extensions of the subarachnoid space surrounding the penetrating arteries.3 Like WM lesions, EPVS are not usually present (although a few may be observed) in the brains of healthy young adults, but become increasingly common with ageing.4 The presence of EPVS has been associated with hypertension,5 cerebral arteriosclerosis,6 Parkinson’s disease,7 CADASIL,8 and diabetes.9 In some studies the number and size of EPVS correlated with the extent of WM lesions.4,10 However, EPVS are not explicitly included in most WM lesion scales, including the most recently published scale,11 and to our knowledge have not been assessed in any published studies of cognitive changes with ageing and WM lesions.

Magnetic resonance scans of enlarged perivascular spaces. (A) Multiple and (B) few enlarged perivascular spaces.
In the present study, we investigated whether EPVS were related to cognitive function in 100 healthy elderly men. We also examined the relations between EPVS, scores on several commonly used WM lesion rating scales, and cognitive function.
METHODS
Subjects
Healthy male volunteers aged 65–70 years, living in Edinburgh, Scotland, were recruited for the study through an invitation letter and interview. The study was approved by the Lothian Region Ethics Committee. All subjects were recruited with the assistance of their local general practitioners and interviewed by a physician (AM) to screen for symptoms suggestive of significant current illness, including dementia, cerebrovascular disease, ischaemic heart disease, and depressive illness. Those with symptoms were excluded. Volunteers with past history of cancer, heart disease, respiratory disease, diabetes, neurological disease, and other significant disease were also excluded. We analysed blood for urea and electrolytes, calcium, liver function tests, thyroid function tests, glucose, glycosylated haemoglobin, haemoglobin, white cell count, platelet count, and B12 and folate levels; subjects with abnormalities according to standard clinical criteria were excluded. None of the subjects was on regular medication at the time of cognitive testing or imaging. A total of 100 subjects participated in the study following the screening process.
Magnetic resonance scanning
All MR scanning was performed on a GE Prestige scanner operating at 1.9 T (GE Medical, Haifa, Israel). Structural image acquisition followed a three view localiser and consisted of fast spin echo T2 axial imaging of the whole brain (TR 4000, TE 96, matrix 256×256, 5 mm slice thickness, 1 mm slice gap, 23 cm field of view, 1 NEX, tip angle 160 and acquisition time 1 minute 40 seconds). The subjects also were also scanned for volumetric and spectroscopic analyses, the details and results of which have been published elsewhere.12,13
Rating of enlarged perivascular spaces and white matter lesions
The WM rating scales used to score the appearance of the white matter on the T2-weighted axial image were as follows: Longstreth et al,14 Breteler et al,15 van Swieten et al,16 Fazekas et al,17 Shimada et al,18 and Wahlund et al.19 Each was applied according to the published method. For rating, each scan was independently examined by two raters blinded to each other’s readings, and all other imaging, cognitive, and biochemical results. One of the raters was a neuroradiologist (JMW) and the other a postdoctoral neuroscientist (KJF). Most scales showed weighted κ of 0.6 or above20; in scales with lower κ, JMW’s ratings were used. In addition, JMW rated the quantity of EPVS in the hippocampus, and basal ganglia/centrum semiovale (including immediate subcortical white matter) as follows: 0 = no EPVS, 1 = <10 EPVS, 2 = 10–20 EPVS, 3 = 21–40 EPVS, and 4 = >40 EPVS. In each case the most affected hemisphere was rated. EPVS were defined (as in previous publications4,10) as small, sharply delineated structures of CSF signal intensity that follow the orientation of the perforating vessels and run perpendicular to the brain surface. Thus they appear round if axially sectioned (as in the basal ganglia) and linear if longitudinally sectioned (as in the peripheral centrum semiovale). They are generally less than 1 mm, at most 2 mm, in diameter. They are of high signal on T2 and low signal on T1 and so are best seen on sequences which show CSF as of bright white signal—that is, on T2-weighted sequences.
Cognitive testing
The subjects underwent tests designed to assess several domains of cognitive functioning; memory was tested in detail. All testing was carried out in the morning by the same tester (AM) who was blind to the results of brain imaging and biochemistry. The order of tests was the same for all subjects; frequent breaks were provided to reduce the effects of fatigue. Fluid, non-verbal reasoning was evaluated with Raven’s Standard Progressive Matrices21 using the number correct in 20 minutes. Verbal memory was evaluated with the Logical Memory (immediate and 30 minute delayed) subtest of the Wechsler Memory Scale22 and the Rey Auditory-Verbal Learning Test.23 Visuospatial memory was evaluated with the Visual Reproduction (immediate and 30 minute delayed) subtest of the Wechsler Memory Scale22 and Administration A of the Benton Visual Retention Test.24 As the immediate and delayed components of both Logical Memory and Visual Reproduction are highly correlated (r = 0.83 and r = 0.75, respectively) the summed standardised scores from each component were entered into the analysis. Verbal fluency was assessed with the Controlled Word Association Test using the letters C, F, and S.23 Attention and processing speed were evaluated with the Digit-Symbol Substitution Test from the Wechsler Adult Intelligence Scale.25 Prior intelligence was assessed with the National Adult Reading Test.26 Performance on the National Adult Reading Test (NART) tends not to show decrements early in the process of ageing related cognitive impairment,27 whereas performance on tests of short term memory and fluid intelligence does show decline with ageing.28
Statistical analysis
Descriptive statistics, bivariate correlations and principal components analyses were performed using SPSS for Windows 11.5.
As scores in diverse cognitive tests are substantially positively intercorrelated,29 the cognitive test data were subjected to principal components analysis, except the NART because it is an estimate of prior intelligence rather than a measure of current ability. Thus NART scores are commonly used to adjust current scores on cognitive tests for prior intelligence. This is done with linear regression, using the saved residuals as the adjusted scores. The adjusted scores therefore are an estimate of ageing related change in cognitive function.30–33
EPVS and the various WM lesion scores were correlated with cognitive test performance and also with the factors derived from the principal components analysis of cognitive test scores. Spearman’s ρ (rho; rank correlation) was used for these correlations because of the non-normal distribution of many WM scores and the EPVS scores. WM lesion scores were also subjected to principal components analysis to provide a summary score and thus to reduce the number of comparisons. Because of the experimental nature of the EPVS scales, we also used analysis of variance to investigate group differences of scores on cognitive function tests and cognitive factors (with NART entered as a covariate) for subjects with no EPVS versus those with some EPVS. Additionally, we used multiple linear regression to determine whether EPVS scores and WM lesion scales had independent associations with cognitive function.
RESULTS
Of the 100 participants scanned, three were excluded when unexpected pathology was discovered on structural MRI: two because of congenital arachnoid cysts, and one because of a pituitary adenoma (non-secretory). For the correlation analyses, 97 subjects were included for all comparisons except Raven’s matrices (n = 95), where two subjects were excluded because of incorrect completion of the answer sheets, logical memory (n = 96), where one subject’s score was invalid because of interruption of the testing session, and visual reproduction (n = 96), where another subject’s test session was interrupted.
The mean age was 67.8 years (range 65–70). Both EPVS and WM lesion scores ranged from the lowest to the highest possible scores. However, as might be expected in relatively healthy group, the lower scores predominated, resulting in a positive skew. For the basal ganglia/centrum semiovale EPVS scores, the numbers in each category of the scale described above were 0: 28; 1: 47; 2: 15; 3: 6; 4: 1. Table 1 shows the descriptive statistics for each scale.
Descriptive statistics for the enlarged perivascular spaces scores and the white matter lesion scales (n = 97)
Correlations among EPVS scores and white matter lesion scales
As the EPVS and WM lesion scores were not normally distributed, Spearman’s ρ was used for all correlations. Scores on the WM lesion scales were very highly intercorrelated (table 2), with ρ ranging from 0.61 to 0.91. Basal ganglia/centrum semiovale EPVS scores were significantly positively correlated with all the WM lesion scales, although the correlations were clearly lower, ranging from 0.25 (p = 0.014) to 0.50 (p<0.001). Because of the high intercorrelations between the WM lesion scales we performed a principal components analysis, which yielded a single unrotated component explaining 80.4% of the variance, designated the white matter lesion factor (WML factor). This first component had an eigenvalue of 6.4, with the smaller components having eigenvalues of 0.53 or less. The components’ loadings are shown in table 3. The WML factor and EPVS scores were significantly correlated (ρ = 0.48, p<0.0001). EPVS scores for the hippocampus were significantly positively correlated with the EPVS scores for the basal ganglia/centrum semiovale (ρ = 0.35, p = 0.001) but were only significantly positively correlated with the individual Longstreth and Fazekas WM lesion scales.
Correlations among the EPVS scores and WM lesion scales
Factor loadings of white matter lesion scales
Correlations between cognitive function, EPVS scores, and white matter scores
EPVS, hippocampus EPVS, and the WML factor correlated with cognitive test scores after controlling for prior intelligence, using the NART. One subject’s score for Raven’s matrices was excluded as the standardised residual value in the linear regression analysis after controlling for the NART was greater than three standard deviations from the mean. Correlations between the WML factor and EPVS scores with the NART estimate of prior intelligence, and the unadjusted other cognitive tests, were non-significant. NART adjusted Raven’s matrices performance correlated significantly and negatively with the basal ganglia/centrum semiovale EPVS (ρ = –0.21, p = 0.038), indicating that people with fewer EPVS have relatively good non-verbal reasoning after adjusting for prior intelligence. Adjusted Raven’s matrices scores also correlated significantly and negatively with the WML factor (ρ = −0.29, p = 0.004). Adjusted cognitive function scores did not correlate significantly with the hippocampus EPVS scale. Unexpectedly, adjusted Auditory-Verbal Learning Test scores were significantly and positively correlated with the WML factor (ρ = −0.25, p = 0.014).
As a result of universal significant positive intercorrelations among the cognitive test scores, we carried out data reduction with principal components analysis, excluding the NART scores. Exclusions because of missing cognitive test data meant that factor scores from 92 participants were available. The first unrotated component accounted for 51% of the variance and had an eigenvalue of 3.53. This was designated the “general cognitive factor”. Two components had eigenvalues greater than 1. The data were subjected to direct oblimin rotation and the two rotated components were designated the “visuospatial factor” (eigenvalue = 3.27) and the “verbal memory factor” (eigenvalue = 2.30) as determined from the pattern of loadings of the individual tests. The components’ loadings are shown in table 4. The subjects’ scores on each of these two rotated factors, and the general cognitive factor, were adjusted for NART estimates of prior intelligence as with the individual cognitive test scores. Adjusted visuospatial factor scores correlated significantly and negatively with the basal ganglia/centrum semiovale EPVS scores (ρ = −0.22, p = 0.032) and with the WML factor (ρ = −0.26, p = 0.012), but not with hippocampus EPVS scores. The correlations are shown in table 5.
Factor loadings of cognitive tests
Correlations between EPVS, WML factor and adjusted cognitive factor scores†
Using multiple linear regression we found that basal ganglia/centrum EPVS scores did not have a significant independent association with the visuospatial factor scores, whereas the WML factor did have a significant independent association. The regression coefficients were −0.246 (p = 0.018) for the WML factor, and −0.176 (p = 0.102) for EPVS scores.
Enlarged perivascular spaces: group comparisons
As scales for measuring EPVS have not been published, we also used an alternative method of analysis. We compared cognitive function in the subjects with some EPVS (scores 1 and 2; n = 69) with that of the subjects with no EPVS in the basal ganglia/centrum semiovale (n = 28). Individuals with some EPVS had significantly worse performance compared with those with no EPVS on the visuospatial factor only (adjusted for NART; F = 4.9, p = 0.029).
DISCUSSION
The novel finding in this study is that increased basal ganglia/centrum semiovale EPVS as measured by MRI in a sample of 97 healthy men aged 65–70 years is associated with worse non-verbal reasoning and, more generally, visuospatial cognitive ability after adjusting for prior intelligence. The correlations were modest but were statistically significant and of similar size to those found between WM lesion scales and cognitive function in published studies.1 EPVS specific to the hippocampus and cognitive ability were not significantly correlated. We also replicated, using a range of published WM lesion scales, the finding that WM lesions are negatively correlated with cognitive scores (adjusted for prior intelligence) in older people. This is consistent with recent work showing that WM lesions correlate with cognitive ability in older individuals but not with childhood cognitive ability.33
The main implication of this finding is that MRI based assessments of changes in WM lesion scales should perhaps add a measure of EPVS. This will allow further exploration of whether EPVS are a form of relatively distinct pathological change seen in the ageing brain and in various disease states, or merely a benign manifestation of ageing, or are part of the sequence of development of WM lesions, whatever the aetiology.
In the present study EPVS scores correlated moderately and significantly with WM lesion scores, but the intercorrelations among the WM lesion scores were higher than the correlations between the EPVS and WM lesion scores, suggesting that EPVS are not directly homologous with MRI derived WM lesions. In the present study, EPVS did not have a statistically significant independent association with cognitive function However, this may not be true for populations with more EPVS and WM lesions, and with more cognitive dysfunction. In addition, despite being reasonably large, our sample size was still insufficient to exclude a modest independent association between WML and EPVS. These questions could be addressed in future studies or by retrospective analyses of existing data. EPVS might have some substantial independent association with respect to brain state.
In addition, current WM lesion scales may not adequately discriminate between different types of WM lesions. Given the wide variation in patterns of WM abnormality in older people—many EPVS but little other WM lesions; increased signal in the immediate periventricular WM but not elsewhere; many confluent WM lesions but few EPVS or periventricular WM lesions; and mixtures of these extremes—it seems likely that different forms of WM lesion and EPVS may represent different aspects of pathology. Larger studies with subjects with different risk factors, with more WM lesions and EPVS, and follow up to determine the pattern of lesion development over time may help to address this.
In terms of neuroimaging, EPVS are largely distinguishable from other WM lesions, but at the neuropathological level, there may be overlap. For example, Udaka and coworkers10 found that in 43 aged subjects with known cerebrovascular disease, WM lesions on MRI were associated with subependymal gliosis, myelin pallor and microinfarctions, and also dilatation of the perivascular spaces. From this study it seems as if there is imperfect mapping of neuropathology to neuroimaging. Therefore, an empirical approach, attempting to classify all the WM changes seen on MRI in the ageing brain, seems justified.
Unexpectedly, there was a positive correlation between scores (adjusted for prior intelligence), on one of two measures of verbal memory used here, the Auditory-Verbal Learning Test, and scores on several WM lesion scales and the WML factor. This is difficult to explain, as WM lesions probably represent some form of injury to the brain and one would expect this to affect cognitive function adversely. This finding also contradicts other work which shows that memory is worse in people with more WM lesions. However, the verbal memory factor did not correlate positively with WM lesion scores or the WML Factor. EPVS scores did not show any correlation with scores on the Auditory-Verbal Learning Test.
Some methodological limitations of this study must be noted. The sample consisted only of men and was not randomly selected. Thus the findings may not generalise to the background population. The subjects were also young-elderly and had limited WM disease. Our EPVS scale was developed inhouse and requires further validation and reliability studies.
In conclusion, we found that EPVS were associated with cognitive decline in otherwise healthy men, and replicated previous work showing that WM lesion load is associated with cognitive decline. Future work will help determine if this is a genuine finding, and if so, whether a greater number of EPVS is associated with worse cognitive function. EPVS should be included in assessments of WM change on MRI scans to better characterise their relations with other measures and risk factors of WM disease.
Acknowledgments
We thank Ian Marshall, Evelyn Cowie, Annette Blane, and Jim Cannon for technical support.
REFERENCES
Footnotes
-
This work was funded by a Medical Research Fellowship and a Project Grant from the Scottish Hospital Endowments Research Trust, and a Research Development Grant from the Scottish Higher Education Funding Council.
-
Competing interests: none declared
-
I J Deary is the recipient of a Royal Society-Wolfson Research Merit Award.
The brain imaging work was performed in the SHEFC Brain Imaging Research Centre for Scotland (www.dcn.ed.ac.uk/bic).
Linked Articles
- Editorial commentary