Article Text

Abstract
Rationale The role of hypertension in cerebral small vessel disease is poorly understood. At the base of the brain (the ‘vascular centrencephalon’), short straight arteries transmit blood pressure directly to small resistance vessels; the cerebral convexity is supplied by long arteries with many branches, resulting in a drop in blood pressure. Hypertensive small vessel disease (lipohyalinosis) causes the classically described lacunar infarctions at the base of the brain; however, periventricular white matter intensities (WMIs) seen on MRI and WMI in subcortical areas over the convexity, which are often also called ‘lacunes’, probably have different aetiologies.
Objectives We studied pressure gradients from proximal to distal regions of the cerebral vasculature by mathematical modelling.
Methods and results Blood flow/pressure equations were solved in an Anatomically Detailed Arterial Network (ADAN) model, considering a normotensive and a hypertensive case. Model parameters were suitably modified to account for structural changes in arterial vessels in the hypertensive scenario. Computations predict a marked drop in blood pressure from large and medium-sized cerebral vessels to cerebral peripheral beds. When blood pressure in the brachial artery is 192/113 mm Hg, the pressure in the small arterioles of the posterior parietal artery bed would be only 117/68 mm Hg. In the normotensive case, with blood pressure in the brachial artery of 117/75 mm Hg, the pressure in small parietal arterioles would be only 59/38 mm Hg.
Conclusion These findings have important implications for understanding small vessel disease. The marked pressure gradient across cerebral arteries should be taken into account when evaluating the pathogenesis of small WMIs on MRI. Hypertensive small vessel disease, affecting the arterioles at the base of the brain should be distinguished from small vessel disease in subcortical regions of the convexity and venous disease in the periventricular white matter.
- Small vessel disease
- lacunar
- lobar
- amyloid
- blood pressure
- mathematicalmodelling
This is an Open Access article distributed in accordance with the Creative Commons Attribution Non Commercial (CC BY-NC 4.0) license, which permits others to distribute, remix, adapt, build upon this work non-commercially, and license their derivative works on different terms, provided the original work is properly cited and the use is non-commercial. See: http://creativecommons.org/licenses/by-nc/4.0/
Statistics from Altmetric.com
Introduction
In recent years, perhaps because of widespread use of MRI, small infarctions producing white matter intensity (WMI) in any part of the brain have begun to be called ‘lacunar’. This has led to confusion about the pathogenesis of small vessel disease. As classically described by Fisher1 and others, lacunar infarctions are located in the base of the brain—internal capsule, basal ganglia, thalamus, brainstem and cerebellum. They are thought to be caused mainly by damage to small arterioles by high blood pressure, with lipohyalinosis or fibrinoid necrosis. When these small vessels occlude, the result is lacunar infarction; when they rupture, the result is hypertensive intracerebral haemorrhage, in the same locations. Hachinski and Norris described this vascular distribution as the ‘vascular centrencephalon’,2 the phylogenetically ancient part of the brain supplied by short, straight arteries with few branches, transmitting high pressure directly from large arteries to the small resistance vessels. In that distribution, high blood pressure per se directly damages small arterioles, causing lipohyalinosis and fibrinoid necrosis.
However, the small arterioles of the cortex, over the convexity of the hemispheres, are supplied by long arteries with many branches, resulting in a drop in blood pressure. Thus small subcortical WMIs in the cortical mantle over the convexity, often attributed to ‘small vessel disease’, and lobar haemorrhages, should probably not be attributed to hypertensive small vessel disease; other pathophysiological mechanisms should be explored. Lobar microhaemorrhages associated with cognitive decline have been attributed to amyloid angiopathy.3 Caplan has suggested4 that microatheroma may account for some of small vessel disease. This may be more common in diabetes mellitus, another cause of ‘small vessel disease’, and which is associated with a higher prevalence of intracranial stenosis of larger arteries.5 Recently he pointed out6 that conditions ‘that affect small arterioles and capillaries originating from peripheral branches of the large intracranial arteries that supply blood to the more superficial regions of the brain’ are heterogeneous.
Black et al reported7 that small periventricular infarctions associated with leucoaraiosis were attributable to venous congestion.
Thus, it seems that apart from vasculitis and rare conditions such as Cerebral Autosomal-Dominant Arteriopathy with Subcortical Infarcts and Leukoencephalopathy (CADASIL), there are probably several different kinds of ‘small vessel disease’: lipohyalinosis in the vascular centrencephalon, caused directly by high blood pressure, and other conditions such as amyloid angiopathy affecting the distal end of the arterial tree, that by impairing vascular reactivity and thus impairing autoregulation of cerebral blood flow, may particularly predispose the distal vascular bed of the brain to ischaemia during drops in blood pressure.
Although it has been intuitively obvious that the blood pressure must be lower over the convexity than in the vascular centrencephalon, and there are a few studies showing a drop in pressure from large arteries to large cerebral arterioles, the pressure gradient from the base of the brain to the microvasculature of the subcortical convexity of the cerebral hemispheres has not previously been quantified, largely because it has not been technically feasible to perform such measurements directly. In this study, we sought to do so by computational modelling.
Materials and methods
Arterial model
In the present work, we employed an Anatomically Detailed Arterial Network (ADAN) computational haemodynamics model to quantify the regional pressure in the cerebral vessels. The ADAN model was developed according to classical anatomy texts, including all arterial vessels with a well-established name in the specialised literature.8 9 The arterial vasculature supplies blood to 28 specific organs and to 116 vascular territories. For a detailed description of the model and the criteria used to define blood flow distribution among organs and vascular territories, the reader is directed to Blanco et al.10 11 Figure 1 presents the entire model with a detail of the vasculature of the head.
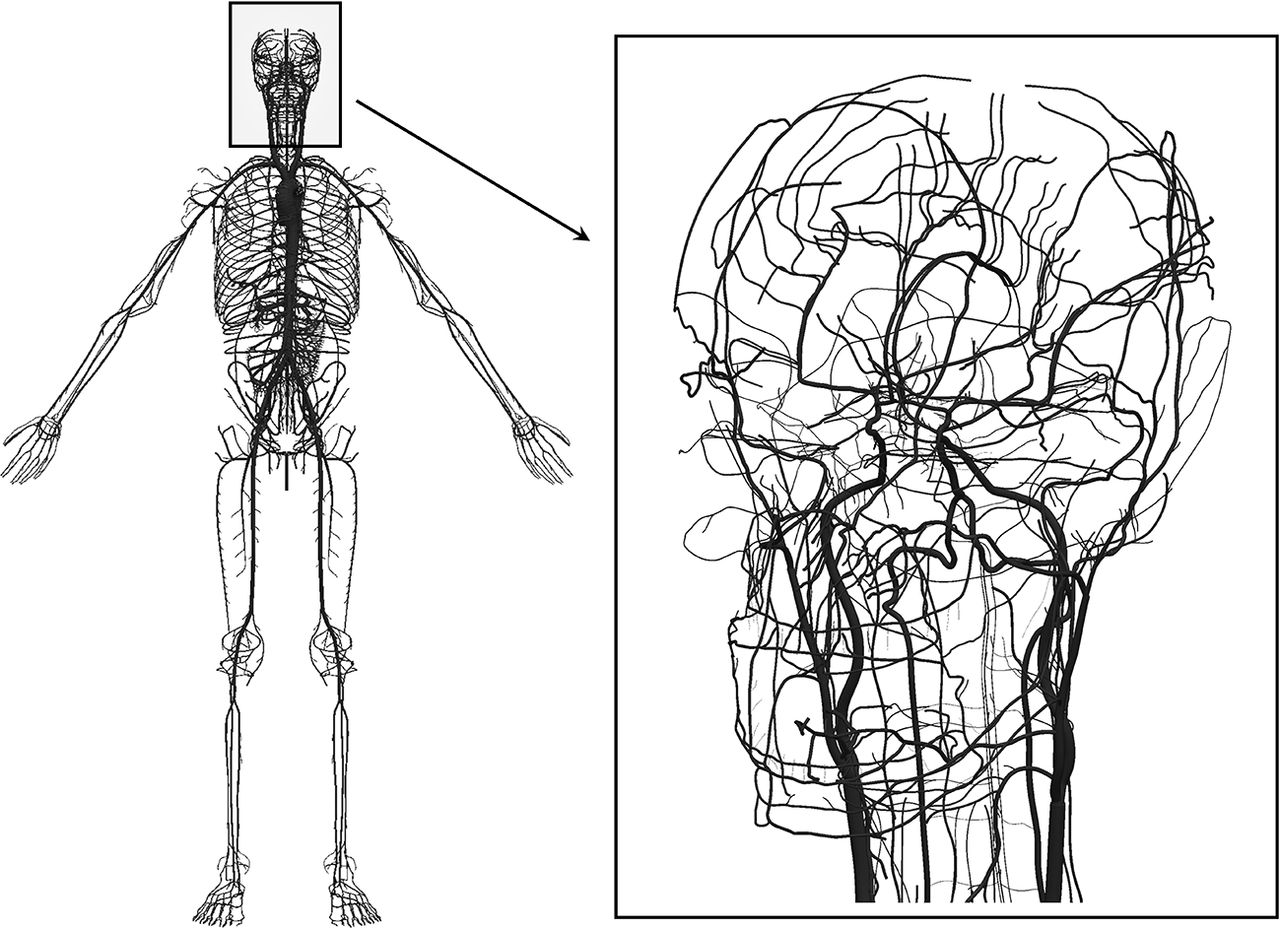
Anatomically Detailed Arterial Network (ADAN) model with detail of the vasculature in the head. Computational haemodynamics model containing over 2000 arterial vessels to simulate pulsatile pressure and blood flow rate using mass and momentum conservation principles. For the intracranial vasculature, 162 cerebral vessels are considered.
Mathematical model
Blood flow in deformable vessels is simulated using a one-dimensional (1D) description of the mass and momentum conservation principles. The model of the arterial wall accounts for the contributions of elastin, collagen and smooth muscle. The model allows the prediction of flow rate (Q), pressure (P) and luminal area (A) at any position and time for each arterial vessel (see model in figure 1). At junctions between vessels, conservation of mass and of total dynamic pressure are enforced. The remaining network of arterioles and capillaries is modelled using Windkessel models.
A number of studies have shown that these 1D models reliably reproduce pressure and flow waveforms in vessel networks, using in vitro experiments and in vivo measurements.12–15 Mathematical formulae are presented in detail in the Supplementary Material. The interested reader is directed to works by Blanco et al 10 11 16 and Müller et al 17 for further details.
Arteriolar beds
Arteriolar networks are automatically generated using an optimisation technique (constrained constructive optimisation (CCO) technique) which follows well-defined morphometric and functional rules.16 18
These arteriolar trees were constructed for two specific peripheral sites, namely the peripheral bed of the lenticulostriate artery and the peripheral bed of the posterior parietal branch of the middle cerebral artery. Blood flow in the CCO-generated networks is simulated using the same physical principles as for arteries. The blood rheology in small vessels is modelled as suggested by Pries et al 19 in order to account for viscosity variation as function of the vessel radius. Indeed, for lumen calibres <300 µm, the multiphasic nature of blood cannot be neglected and the effect of the rearrangement of red blood cells on blood viscosity must by properly modelled.
Microcirculation at terminal locations of the arteriolar networks is modelled using purely resistive elements. The resistances are set up in a way that ensures that the average flow rate is the same for all the outlets of the network. This hypothesis is in compliance with the principle of size invariance of terminal units in circulation networks in mammalians.20
From the fluid mechanics perspective, the same mathematical model as the one adopted for large arteries is used for the vessels in the arteriolar networks. That is, arterioles are considered as deformable vessels.
Normotensive and hypertensive scenarios
The setting of the normotensive scenario follows the calibration criteria proposed by Blanco et al.10 11 Model parameters that describe the structural changes from normotensive to hypertensive conditions are: the thickness of the arterial vessels hN, the lumen radius of the arterial vessels  , the total resistance of the network
  and the total compliance of the network
  (N denotes the normotensive case).
To model the hypertensive scenario, the following modifications for the model parameters of the arterial and arteriolar vessels were considered in all the vessels of the model including the CCO networks representing arterioles (H denotes the hypertensive case): wall thickness was increased 50%, that is,  , vessel radii were decreased 10%, that is,
  , terminal model resistance was increased 60%, such that the mean arterial pressure (MAP) is incremented 50% in central arteries, that is,
  , terminal model compliance was decreased 23% in accordance with the stiffening observed in arterial vessels, that is,
  . These alterations are in agreement with the observed structural changes in arterial vessels in hypertensive humans21 22and animals (rats).23–26
Because of the variability of reported measurements in the literature for hypertension-related arterial structural changes, a sensitivity analysis was performed. This sensitivity analysis aimed at studying the difference observed in blood pressure at different peripheral beds with respect to hypertensive remodelling hypotheses. More specifically, we computed the impact of model parameters on the pressure difference between lenticulostriate bed vessels and posterior parietal bed vessels. We refer to this quantity as differential (centrencephalic minus cortical) pressure. The variation of the following model parameters was studied (with respect to the normotensive scenario): vessel radii (ΔRo reduction of 5% and 15%), wall thickness (Δh increase of 25% and 75%), peripheral resistance (ΔRW increase of 30% and 90%) and network compliance (ΔCW reduction of 10% and 40%). Sensitivities are computed relative to the differential pressure found in the hypertensive scenario considered above, for which the following setting was used: ΔRo=10%, Δh=50%, ΔRW=60% and ΔCW=23%.
Results
There is a marked drop in blood pressure from the vascular centrencephalon to the subcortical microvasculature over the convexity in both the normotensive case and the hypertensive case. Figure 2 presents the results of the simulations for the two considered scenarios: normotensive (N) and hypertensive (H). Pulsatile arterial pressure (mean between brackets) is displayed at selected arterial vessels covering medium-sized arteries and small-sized arteries.
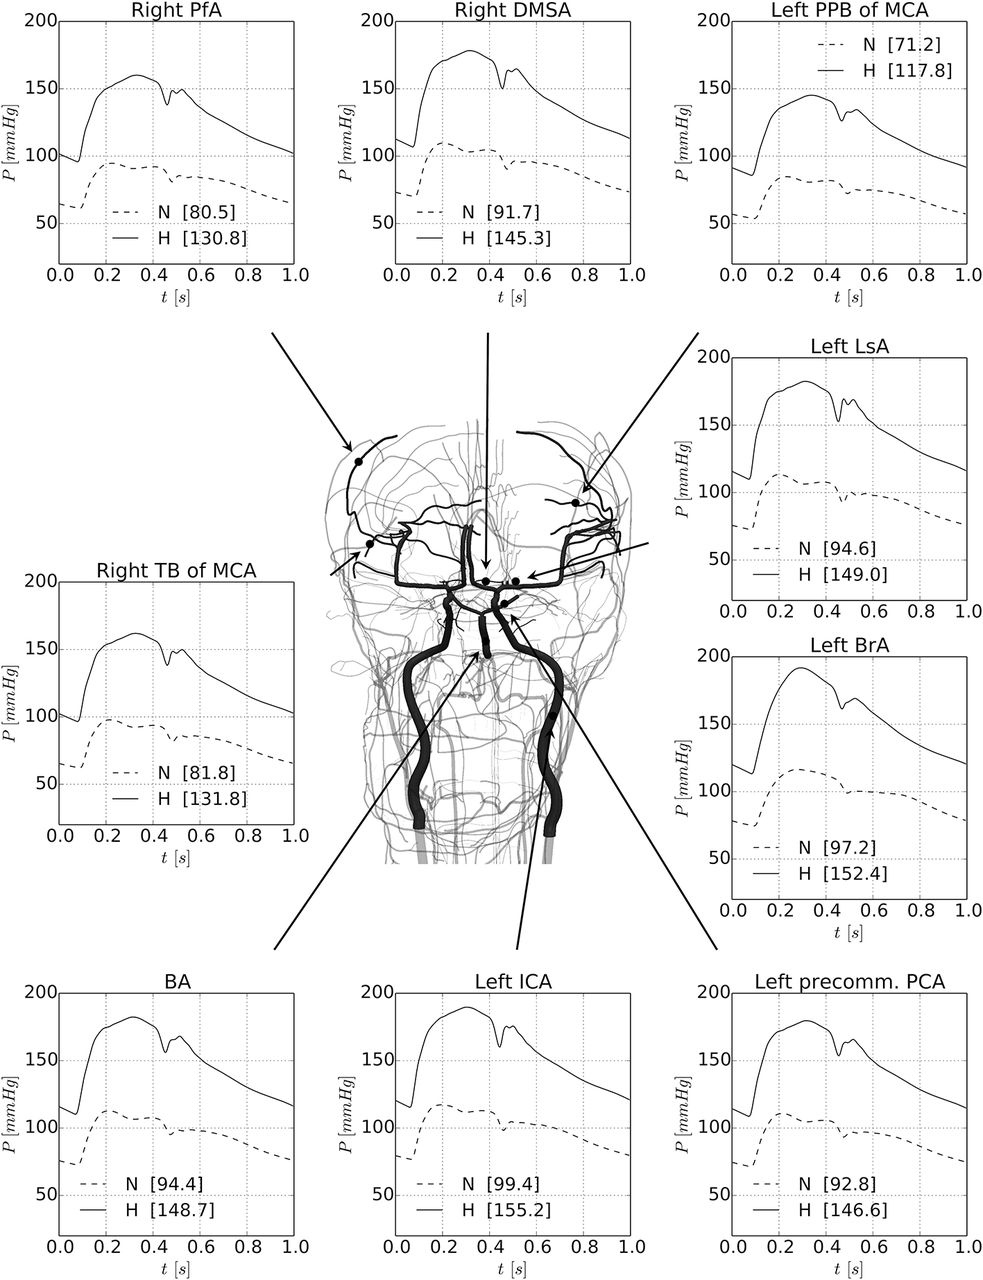
Results of the simulations for the two considered scenarios: normotensive (N) and hypertensive (H). Pulsatile arterial pressure (mean between brackets) is displayed at selected arterial vessels covering medium-sized arteries and small-sized arteries. Vessels have been picked up in both centrencephalic and cortical areas. The MAP, SBP and DBP at the same arterial vessels are also reported in table 1 for the normotensive (N) and hypertensive (H) cases. BA, basilar artery; BrA, brachial artery; DBP, diastolic pressure; DMSA, distal medial striate artery; ICA, internal carotid artery; LsA, lenticulostriate artery; MAP, mean arterial pressure; MCA, middle cerebral artery; PCA, posterior cerebral artery; PfA, prefrontal artery; PPB, posterior parietal branch; SBP, systolic blood pressure; TB, terminal branch.
Vessels have been illustrated in both centrencephalic and cortical areas in the convexity. The systolic pressure (SBP) and diastolic pressure (DBP) at the same arterial vessels are also reported in table 1 for both the normotensive and the hypertensive cases.
Diameter (D = 2Ro in mm) and systolic/diastolic arterial pressure (SBP/DBP in mm Hg) at several arterial locations with focus in cerebral arteries. Pressure values correspond to the pressure predicted at the midpoint of the vessels for the normotensive (N) and hypertensive (H) cases.
It can be seen that the pressure in cortical vessels should be much lower than in central arteries and in centrencephalic vessels. In the hypertensive case, in the brachial and the internal carotid arteries, SBP reaches 190 mm Hg, whereas in large cortical arteries, it is around 150 mm Hg. The MAP goes down from approximately 150 to 130 mm Hg. In the most distal vessel (posterior parietal artery), the pressure is even lower, showing that the rich branching of the cerebral vasculature protects the cortical microvasculature from high pressures.
The pressure levels predicted by the model in the arteriolar networks of the lenticulostriate artery and of the posterior parietal branch of the middle cerebral artery are shown in figure 3.

Detail of the peripheral beds corresponding to the lenticulostriate artery and to the posterior parietal branch of the middle cerebral artery. Pressure waveforms are shown for the normotensive (N, dashed line) and hypertensive (H, solid line) cases. Right panels (top and bottom) display the pressure waveform in the feeding artery to the corresponding arteriolar networks. Middle and left panels show the pressure level in arterioles with diameter ranges between D ∈ (190 μm, 210 μm) and D ∈ (30 μm, 50 μm), respectively; n indicates the number of vessels taken to calculate the average and SD pressure waveforms (grey-shaded area). In brackets, the mean arterial pressure is reported. LsA, lenticulostriate artery; MCA, middle cerebral artery; PPB, posterior parietal branch.
The mean and SD of the pressure waveform for vessels with diameter in the range D ∈ (190 μm, 210 μm) and the second group corresponding to diameter range D ∈ (30 μm, 50 μm) are displayed in figure 3. In addition, the MAP is shown in figure 4 for both peripheral beds, in which the different haemodynamic conditions to which arteriolar networks are subjected can be appreciated.

Mean arterial pressure throughout the peripheral beds under analysis. Arteriolar regional pressure drop for the peripheral arterioles of the lenticulostriate artery (top row) and of the posterior parietal branch of the middle cerebral artery (bottom row), for the normotensive case (left column) and the hypertensive case (right column).
From these results, it clearly emerges that the higher pressure values in centrencephalic arteries and lower pressures in cortical arteries are also encountered in their respective arteriolar beds, for both normotensive and hypertensive conditions. Cortical arterioles of the posterior parietal artery have a mean normotensive MAP of 50 mm Hg, and a hypertensive MAP of 95 mm Hg. In turn, at the base of the brain, the lenticulostriate artery is exposed to a normotensive MAP of 77 mm Hg and to a hypertensive MAP of 127 mm Hg. Thus, normotensive pressure gradient from the centrencephalon to the cortex is 18 mm Hg (36% with respect to the cortical arteriolar MAP), whereas the hypertensive pressure gradient increases to 32 mm Hg (34% with respect to the centrencephalic arteriolar MAP).
Regarding the blood flow, from the model results it is obtained that the pulsatility index (PIN: normotensive index, PIH: hypertensive index) in the different regions of the brain also differs. In the lenticulostriate artery and arterioles, it is PIN = 0.649; PIH = 0.661 and PIN = 0.433; PIH = 0.512, respectively. In turn, in the posterior parietal artery and arterioles, it is PIN = 0.617; PIH = 0.665 and PIN =0.424; PIH = 0.515, respectively.
A sensitivity analysis of the differential (centrencephalic minus cortical) SBP and DBP (in % of the differential pressure obtained for the hypertensive scenario) is reported in table 2.
Sensitivity analysis of the differential systolic and diastolic pressures (ie, pressure in the lenticulostriate vessels minus pressure in the posterior parietal vessels) with respect to modification of several model parameters
These results correspond to three classes of vessels, namely: vascular bed feeding arteries and arterioles in the ranges D ∈ (190 μm, 210 μm) and D ∈ (30 μm, 50 μm). The present sensitivity study aimed at analysing the model predictions for several conditions of hypertensive remodelling, that is, considering scenarios with different MAP and pressure pulses (PP = SBP–DBP). The sensitivities for the differential SBP and DBP are found to be larger when modifying the lumen radius of the vessels, followed by the arterial wall thickness and the peripheral resistance, and finally the peripheral compliance. When the alterations are directed towards a normotensive condition, the differential pressure tends to decrease and vice versa. In addition, the sensitivity of the differential SBP is greater than that of the differential DBP for variations in lumen radius and wall thickness. When modifying the peripheral resistance, the differential DBP tends to be more affected, and almost no sensitivity is observed with respect to the peripheral compliance.
Discussion
Our findings based on mathematical modelling predict a marked drop in pressure from the vascular centrencephalon to the microvasculature supplying the subcortical white matter over the convexity. These findings should lead to different ways of thinking about the pathogenesis of small vessel disease causing small infarctions regarded as ‘subcortical WMIs’. Some international efforts at understanding these processes have tended to lump together all small vessel disease and ‘lacunar’ infarctions,27 although a recent consensus statement made a distinction between lacunar infarctions and ‘Binswanger’s disease’ that may be better understood in the light of the blood pressure gradients we predict.
Human studies
There are very few human studies reporting blood pressures in cerebral arteries, and we could find none measuring pressures in distal arterioles. Most of the literature in this area focuses on changes in the diameter of cerebral vessels in response to changes in blood pressure, relating to autoregulation, without measurement of intravascular pressures.21 A study in neurosurgical patients with subarachnoid haemorrhage22 reported MAP in the anterior cerebral artery from 57 to 89 mm Hg in one case and 67–81 mm Hg in another. In patients undergoing superficial temporal to middle cerebral artery anastomosis (STA-MCAA), Shima et al 28 reported middle cerebral artery MAP ranging from 80 to 20 mm Hg, but systemic pressures were not reported, and the patients had stenosis or occlusion of proximal arteries. They suggested that a cortical MAP of 20–30 mm Hg was critical for cortical perfusion. Matano et al reported in 2016 that after STA-MCAA blood pressure in the MCA was 75% of radial artery pressure (60.4±16.5 vs 80.2±14.6 mm Hg), which accords well with our model. (In table 1, the drop in MAP from the radial to the temporal branch of the MCA is 20 mm Hg.)
Animal studies
The few studies we have found in animal models tend to support the marked drops in pressure predicted by our model. Netlyukh et al reported a drop in MAP of 11 mm Hg between the proximal (C1) internal carotid and the intracranial C4 segment of that artery.29 Zweifach reported blood pressures in mesenteric distal vessels of cats, that are similar to what we predict for small subcortical vessels under the convexity – mean arterial capillary pressures ranging from 40 to 20 mm Hg.30 Faraci et al 31 reported that in small cerebral pial arteries of cats (~160 microns), MAP gradients from the aorta to small pial arteries were as follows: from 89±6 to 51±7 mm Hg in control state, from 133±4 to 81±5 mm Hg in moderate hypertension and from 200±5 to 117±5 mm Hg in severe hypertension. MAP in small brainstem arteries were ~20 mm Hg higher than in small pial vessels over the cortex.
Baumbach32 reported a drop from a systemic pressure of 134±7/98±6 to 67±4/53±3 mm Hg in pial arterioles of Sprague-Dawley rats; however, the rat cortex is much smaller, with much shorter arteries and fewer branches than in the human brain, so the drop in pressure would be expected to be much smaller in rats than in man. In another study comparing control mice to mice overexpressing human renin and angiotensinogen, Baumbach et al 33 found that systemic MAP dropped from 117±4 to 40±1 mm Hg in cerebral arterioles of control mice and from 153±6 to 60+4 mm Hg in hypertensive mice. Harper and Bohlen34 compared spontaneously hypertensive rats (SHR) and Wistar Kyoto rats (WKR), and found similar drops in pressure to what we predict. With systemic MAP of 173±14 mm Hg in SHR and 122±8 mm Hg in WKR, the MAP in small cerebral arterioles (fourth-order arterioles either perfusing surface capillaries or descending into the cortical parenchyma) was ~12 mm Hg. We hope our study will stimulate investigators with the technical ability to make blood pressure measurements in small branches of human cerebral blood vessels to do so.
Insights from mathematical models
This work predicts a marked drop in blood pressure from the large arteries at the base of the brain, and the small arteries of the vascular centrencephalon, to the small arterioles over the convexity. The figures of the rich branching of the cerebral vasculature in the figures show why this happens.
From the fluid mechanics point of view, and in the light of model predictions, it is concluded that the strong differences in the values of blood pressure observed at the base of the brain and at cortical locations are caused by the differences in the resistance to flow opposed by the vasculature. Specifically, viscous dissipation in the small and lengthy vessels supplying blood to the cortical peripheral beds is responsible for the larger pressure drop from the central arterial pressure to prearteriolar blood pressure with respect to the pressure drop in the vessels supplying the arterioles at the base of the brain. This is also verified in the sensitivity analysis. In fact, from the geometrical point of view, resistance to flow is proportional to vessel length and inversely proportional to the vessel radius to the power of four. Thus, it is the anatomical arrangement of the cerebral circulation, which determines that lengthy vessels supplying the convexity preserve cortical peripheral beds from high blood pressure.
Concerning physical phenomena, in this work we were interested in the fluid-mechanical aspects of hypertension and, therefore, the model setting reflects this emphasis. In order to properly model the hypertensive condition, we have introduced changes to the model of the normotensive condition that are related to structural changes in the systemic circulation. Blood pressure levels predicted by the present model in the normotensive condition are in agreement with previous computational simulations,35 which in turn were compared against measurements in humans.36 In addition, predicted normotensive and hypertensive pressures in cortical arterioles are in agreement with measurements in animal models34 37 as discussed above. Experimental evidence of blood pressure in vessels at the base of the brain is scarce. However, the estimated pressure in centrencephalic arterioles can be considered acceptable in view of the consistent pressure estimation in cortical vessels, and given that the physical principles behind the simulations are the same.
The sensitivity of differential systolic and diastolic pressures to variations in the parameters that define the hypertensive condition proved to be higher when different remodelling of the lumen radius takes place. However, the differences found with respect to the hypertensive scenario defined here are always <25%. When the hypertensive remodelling is more pronounced (larger decrease of the lumen radius and increase of wall thickness), the pressure difference between lenticulostriate and posterior parietal beds increases. This implies that the results obtained in this study are conservative in the sense that any further alteration of model parameters (stressing the hypertensive condition) tend to increase the pressure difference between cortical and centrencephalic arterioles.
Therapeutic implications
Thus, small WMI over the convexity are probably not attributable to hypertensive small vessel disease (lipohyalinosis), but are more likely to be due to amyloid degeneration or other arteriolar pathologies as discussed by Caplan, and to low diastolic blood pressure in the setting of impaired autoregulation. As discussed above, this is particularly a problem in patients with stiff arteries whose cuff pressures are much higher than their true intra-arterial pressures.38 39
Therapeutic implications of these findings are clear for hypertensive small vessel disease in the vascular centrencephalon. Söros et al 40 recently summarised the evidence that treating hypertension reduces the risk of dementia, by preventing lacunar infarctions.
Whereas in the past approximately 20% of strokes were due to intracranial haemorrhage, strict blood pressure control in the North American Symptomatic Carotid Endarterectomy Trial reduced intracranial haemorrhage to 0.4% of strokes.41 The Systolic Blood Pressure Intervention Trial (SPRINT) recently showed that intensive blood pressure lowering to <120 mm Hg systolic reduced the risk of stroke significantly compared with a more usual blood pressure target of <140 mm Hg.42 Interestingly, they assessed only clinically symptomatic strokes.
Wardlaw’s group43 reported that lacunar infarctions in the vascular centrencephalon were more likely to be symptomatic than small subcortical WMI over the convexity; it is possible that in SPRINT, lower blood diastolic pressures may have prevented hypertensive strokes, while an increase in subcortical WMI may have gone undetected.
However, if WMI over the convexity and periventricular WMI are due to other forms of small vessel disease, then different approaches will be needed to prevent them.
Wardlaw’s group44 found that a wide pulse pressure (which lowers diastolic pressure, for a given MAP) was particularly a risk factor for small subcortical WMI over the convexity. Webb et al reported45 that arterial stiffness and increased pulsatility in the middle cerebral artery were associated with leucoaraiosis. In the setting of arterial stiffness with a wide pulse pressure, treatment to lower the blood pressure may reduce the diastolic blood pressure excessively, particularly when drugs that slow the heart rate (thus widening pulse pressure) are used. False elevation of the cuff blood pressure by stiff arteries38 may account for the observed J curve with low blood pressure in the elderly.
Factors such as amyloid angiopathy in small cortical arterioles, or other pathophysiological mechanisms, by impairing cerebral vascular reactivity and thus cerebral blood flow autoregulation, might aggravate ischaemia due to low diastolic pressure in small convexity arterioles. An example of this is the ‘earthen pipe’ phenomenon in CADASIL.46
Limitations
The principal limitation of this study is that it is based on a mathematical model, with no confirmatory blood pressure measurements. A previous modelling study33 predicted a similar drop in pressure from the aortic root to the middle cerebral artery and a drop in MAP from 94 to 81 mm Hg. However, that study did not extend to smaller more distal branches.
We stress that models are a simplification of reality. However, this simplification must contain all relevant aspects of the modelled phenomenon. The ADAN model is, currently, the most complete model of the human arterial network, including almost all arteries acknowledged by the medical literature. To this complex network we have added arteriolar networks for small portions of the brain, those irrigated by the lenticulostriate artery and the posterior parietal branch of the middle cerebral artery. No differentiation between white and grey matter has been made. These microvascular networks contain 8040 and 24 040 vessels, respectively, and from the fluid mechanics point of view, they can be considered as representative units of the cerebral microvasculature. Thus, the simulations and analysis presented here are representative for other microvascular beds in both the centrencephalon and the cortex.
Conclusion
Predicted blood pressure gradients in the cerebral vasculature may contribute to the understanding of cerebral small vessel disease. Lacunar infarctions in the vascular centrencephalon may be directly attributable to arteriolar damage from high blood pressure, but small WMI in the convexity are more likely to be due to low diastolic blood pressure in the setting of wide pulse pressure from stiff arteries, and impaired autoregulation due to vasculopathy of a different nature, such as amyloid angiopathy. Periventricular WMI may be due to venous congestion. These distinctions have important implications for elucidating the pathophysiology of cerebral small vessel disease, in order to develop approaches to preventing the consequences of small vessel disease, including stroke and dementia.
References
Footnotes
Contributors JDS: conceived the study and wrote the first and subsequent drafts; PJB and LOM: performed the calculations, created the images and contributed to revisions.
Competing interests None declared.
Provenance and peer review Not commissioned; internally peer reviewed.
Data sharing statement All relevant data are within the paper. ADAN model description is fully available in Refs. 10 and 11. ADAN model parameters are fully available (as indicated in Ref. 11) in the repository . Numerical methodology is described in detail in Ref. 17 (and references therein). Regarding the generation of CCO networks we employed algorithms already documented in Refs. 16 and 18. The geometry of CCO networks to perform simulations as well as the mean blood pressure in all peripheral segments is available as a Supplementary Data File (CCO_LsA_N.vtk and CCO_LsA_H.vtk for lenticulostriate artery and CCO_PPB_MCA_N.vtk and CCO_PPB_MCA_H.vtk for the posterior parietal branch of the middle cerebral artery, N: normotensive, H: hypertensive).
Correction notice This paper has been amended since it was published Online First. Owing to a scripting error, some of the publisher names in the references were replaced with ’BMJ Publishing Group'. This only affected the full text version, not the PDF. We have since corrected these errors and the correct publishers have been inserted into the references.