Article Text

Abstract
Background Endothelial microvesicles (EMVs) are closely associated with the status of endothelial cells (ECs). Our earlier study has shown that EMVs could exert protective roles in ECs by transferring their carried miR-125a-5p. However, whether circulating EMVs and their carried miR-125a-5p can be used as biomarkers in ischaemic stroke (IS) are remain unknown.
Methods We recruited 72 subjects with IS, 60 subjects with high stroke risk and 56 age-matched controls. The circulating EMVs and their carried miR-125a-5p (EMV-miR-125a-5p) levels were detected. We used microRNA (miR) array to study expression changes of miRs in plasma EMVs samples of three IS patients and three matched healthy controls. Transient middle cerebral artery occlusion (tMCAO) was used to establish IS mouse model.
Results EMVs level was obviously elevated in IS patients, with the highest level in acute stage, and was positively related to carotid plaque, carotid intima–media thickness (IMT), National Institutes of Health Stroke Scale (NIHSS), infarct volume. On the contrary, we observed that EMV-miR-125a-5p level was obviously reduced in IS, with the lowest level in acute stage, and was negatively correlated with carotid plaque, IMT, NIHSS scores, infarct volume. EMVs and EMV-miR-125a-5p levels were closely related with large artery atherosclerosis subgroup. Importantly, EMVs and EMV-miR-125a-5p levels could serve as independent risk factors, and receiver operating characteristic curve achieved an area under curve (AUC) of 0.720 and 0.832 for IS, respectively, and elevated to 0.881 after their combination. In IS mouse model, control EMVs or n-EMVs administration could decrease the infarct volume and neurological deficit score, while increase the cerebral blood flow of IS mice compared with vehicle group, while IS EMVs or oxygen and glucose deprivation (OGD)-EMVs administration aggravated the tMCAO induced ischaemic injury. In addition, we observed that OGD EMVmiR-125a-5p could partially ameliorate the OGD EMVs induced brain injury after IS.
Conclusions These findings demonstrate that circulating EMVs and EMV-miR-125a-5p are closely related with the occurrence, progress, subtypes and severity of IS, and they can serve as innovative biomarkers and therapeutic targets for IS, especially when they are combined.
- Brain
- Cerebrovascular Circulation
- Cerebral Infarction
- Carotid Stenosis
Data availability statement
All data relevant to the study are included in the article or uploaded as online supplemental information.
This is an open access article distributed in accordance with the Creative Commons Attribution Non Commercial (CC BY-NC 4.0) license, which permits others to distribute, remix, adapt, build upon this work non-commercially, and license their derivative works on different terms, provided the original work is properly cited, appropriate credit is given, any changes made indicated, and the use is non-commercial. See: http://creativecommons.org/licenses/by-nc/4.0/.
Statistics from Altmetric.com
WHAT IS ALREADY KNOWN ON THIS TOPIC
The cargos and functions of endothelial microvesicles (EMVs) rely on the status of endothelial cells.
WHAT THIS STUDY ADDS
This study showed that circulating EMVs and their contained miR-125a-5p were closely related with the initiation and progression of ischaemic stroke (IS). EMVs from normal or ischaemic condition exerted diverse effects on the progress of IS, and miR-125a-5p was an important functional cargo in EMVs, which contributed to reduce the detrimental roles of ischaemic EMVs on IS.
HOW THIS STUDY MIGHT AFFECT RESEARCH, PRACTICE AND/OR POLICY
This study will provide an innovative biomarkers and therapeutic targets for IS.
Introduction
Stroke is a major reason for death and disability worldwide, of which ischaemic stroke (IS) accounts for about 80%.1 Currently, sensitive and specific biomarkers for IS are still lacking.
Dysfunction of endothelial cells (ECs) contributes to the initiation and progress of IS. Biomarkers for detecting the abnormal phenotype changes of ECs may help identifying IS and its development. ECs could secrete microvesicles (EMVs) in response to stress, activation and apoptosis.2 The level and cargo contents of EMVs highly depend on the cellular stress conditions of ECs, which makes EMVs have the potential to reflect the functional status of ECs. The abnormal level of EMVs has been observed in some vascular diseases including diabetes and coronary artery disease.3 Our group and others have reported that circulating EMVs is increased in IS patients.4 MicroRNAs (miRs) are involved in regulating various EC functions, which are abnormally expressed in IS.5 MiRs seem to be the major contents of EMVs involved in the endothelial response to cellular stress induced by inflammation, hypoxia or hyperglycaemia.6 For examples, the level of miR-126 is decreased in EMVs derived from ECs under high glucose treatment, and EMVs derived from TNF-a stimulated ECs contains high level of miR-146a-5p.7 Moreover, EMVs could protect their contained miRs from RNase, making them more stable in microenvironment and peripheral blood.8 Thus, the level of EMVs and their contained miRs could sensitively and stably reflect the status of ECs.
MiR-125a-5p is a brain-enriched miR,9 and it is downregulated in the aorta and peripheral blood of stroke-prone spontaneously hypertensive rats (SHR) after IS.10 Research indicated that EMVs could exert EC protective effects by transferring their carried miR-125a-5p.11 These data indicate that miR-125a-5p plays pivot roles in regulating vascular function and its abnormal expression may relate to the pathogenesis of IS. Thus, we suppose that circulating EMVs and EMV-miR-125a-5p could be novel biomarkers for IS.
This study, we detected EMVs level by combining microbeads with fluorescence Q-dots coupled nanoparticle tracking analysis (NTA) which has been reported in a previous study,12 and investigated whether EMVs/EMV-miR-125a-5p were associated with the stage, carotid remodelling, intima–media thickness (IMT), severity and subtype of IS patients, aiming at determining the perspective of EMVs/EMV-miR-125a-5p as biomarkers for IS, and the roles of EMVs and their carried miR-125a-5p in IS induced brain injury.
Materials and methods
Sample size determination
The sample size was determined by using Power Analysis and Sample Size (PASS V.11, USA) software as our previous study described.4 In the preliminary study, 12 healthy controls and 16 IS patients were included, and the circulating EMVs and EMV-miR-125a-5p levels were measured. The sensitivity and specificity of EMVs and EMV-miR-125a-5p were evaluated by receiver operating characteristic (ROC) curve. By using the data of EMV-miR-125a-5p, results showed that at least 51 controls and 66 IS patients were needed. In view of the 10% drop-out rate, 56 health controls and 72 IS patients should be included. To clarify the correlation between EMVs, EMV-miR-125a-5p and risk factors, we also enrol 60 at risk subjects.
Study subjects and enrollment criteria
We recruited 72 IS patients, 60 at risk subjects and 56 age-matched healthy control from the Affiliated Hospital of Guangdong Medical University in China between June 2020 and June 2021. All IS patients were admitted to hospital and confirmed by MRI or CT.
Based on duration of IS, patients were segmented into acute (<7 days, n=55) and chronic (≥7 days, n=17) subgroups.13 In addition, IS was categorised into four subtypes: large artery atherosclerosis (LAA) (n=26), small artery occlusion (SAO) (n=14), cardioembolism (CE) (n=21) and stroke of undetermined cause (SUE) (n=11) based on the Trial of Org 10 172 in Acute Stroke Treatment criteria.14 The high-risk subjects were defined as those who had one of the stroke risk factors, including diabetes mellitus, hypertension, hyperlipidaemia, hyperhomocysteinaemia (Hcy) and smoking. The high-risk group and control healthy group also completed blood sample collection, medical history recording and conventional tests. The general characteristics of all participants are presented in table 1.
General characteristics in healthy controls, at-risk subjects and IS patients
Participants with the following situations were excluded: including infectious disease, histories of autoimmune disorder, peripheral vascular disease, cerebral haemorrhage, tumour, transient ischaemic attack, cancer histories and cardiac dysfunction.
Rna sequencing analysis
RNAiso Plus kit was used to isolate total RNA from EMVs. The concentration and integrity of the obtained RNA was measured by Qubit V.3.0 Fluorometer (Invitrogen, California) and Agilent 2100 Bioanalyzer (Applied Biosystems, California), respectively. A 100 ng of RNA was used to prepare small RNA library by using QIAseq miR Library Kit (QIAGEN) based on manufacture’s instrument. Briefly, RL3 Adaptor was ligated to 3’ end of miR, siRNA and piRNA. Then, the RT primer was hybridised to the excess of RL3 Adaptor with Unique Molecular Index. RL5 Adaptor was then ligated to 5’ end of miR, siRNA and piRNA. Subsequently, cDNA was synthesised and PCR amplification was performed based on our previous report.15 Finally, the PCR product was purified and the target DNA fragments (140–160 bp) were chosen using polyacrylamide gel or Ampure XP beads. DNA 1000 chip was used to assess the library quality and concentration. QPCR-based KAPA Biosystems Library Quantification kit (Kapa Biosystems) was used to evaluate the accurate quantification for sequencing applications. Each library was diluted and pooled equimolar prior to clustering.
Neurological assessments
The neurological deficits of IS patients were assessed by NIHSS scores and infarct volume. According to the severity of neurological impairment, patients were assigned into NIHSS score ≥7 (n=31) and <7 (n=41) groups.16
MRI and diffusion-weighted imaging (DWI) were used to assess the lesion volume as we previously described.16 Briefly, brain MRI was performed by using 3.0 T MR750 system (GE, USA). The infarct volume was assessed by DWI using a multislice, single-shot spin-echo echo planar sequence. Typical sequence parameters were set, and the infarct volume was calculated by the summation of the slice thickness multiply the total infarct area. Based on infarct volume data, IS patients were segmented into small (<5 cm3, n=26), moderate (5–10 cm3, n=19) and large (>10 cm3, n=27) groups.
Intracranial artery ultrasonography
The carotid artery IMT and carotid plaque were measured by ultrasonograph method as we previously described.17 The distance between the lumen-intima and media-adventitia border of the vascular wall was set as carotid IMT. The average of each side IMT values was used to assess the mean IMT. The criteria set by American College of Radiology Ultrasound Session was used to define the carotid and brain artery stenosis.18 All measurements were performed by the same operator who was a trained neurologist and unaware of the experimental group and goals of analyses.
EMVs isolation, purification and characterisation
EMVs were isolated and purified from peripheral blood sample (4 mL) as we previously described.12 In brief, blood sample was collected from vein of participants and drawn into anticoagulated tubes with EDTA (Wego, Shandong, China), and then centrifuged to collect plasma. To isolate circulating membrane vesicles, plasma samples were diluted three times with PBS and then at gradient density centrifugation. First, diluted plasma centrifuged at 3, 00 g for 15 min to remove cell debris, and then centrifuged at 2000 for 20 min to remove platelet, and centrifuged at 20 000 g for 70 min to pellet circulating MVs. The pellets were resuspended with 100 µL filtered phosphate buffer saline (PBS). The pelleted circulating MVs were incubated with 10 µL of Biotin-conjugated anti-CD105 antibody (Miltenyi Biotec), followed by mixing with anti-Biotin microbeads (Miltenyi Biotec) for 15 min. Then dynaMag-2 magnet (Life technology) was used to isolate the microbeads-tagged circulating MVs from the total circulating MVs. After segregation, the microbeads-bound circulating MVs were collected and incubated with multisort release reagent to clean the microbeads. Then, the circulating MVs (CD105+MVs) were collected and incubated with anti-CD144 for 2 hours, then incubated with Q-dot 655 (1:350 dilution; Life Technologies). Finally, the Q-dot 655 labelled circulating MVs was defined as EMVs. The number and size of EMVs were measured by NTA and transmission electron microscopy (TEM) analysis as our previous report.12
NTA analyisis
The number and diameter of EMVs were detected by NTA as we previous described.12 Briefly, EMVs were diluted in 1 mL PBS and applied to NanoSight (NS300) system to automatically detect the average number and diameter.
TEM analysis
The morphology of EMVs was evaluated by TEM as we previous reported.12 In brief, 10 µl suspended EMVs were loaded onto carbo-coated copper grids. After the sample was dry, micrographs were taken with a JEM-1400 TEM (Hitachi, Japan) at an accelerating voltage of 80 KV.
Efficiency of EMVs purification analysis
The efficiency of EMVs purification according to our previous study described with minor modification.12 In brief, a known quantity (5×10⁸ particles) of EMVs were loaded into 1 mL of particle-free plasma, then pelleted by centrifugation (20, 000 g×70 min, 4°C). The pellets were resuspended with filtered PBS, and recovered by anti-CD105 conjugated-microbeads, followed by incubated with anti-CD144 conjugated-Q-dots and subsequently detected by fluorescence NTA. The purification rate was calculated as: the number of Q-dots positive MVs divided by the total EMVs.
Analysis of EMVs-miR-125a-5p
The CD105+MVs mentioned above were further incubated with anti-CD144 conjugated-microbeads to generate CD105+CD144+EMVs. Total RNA was extracted from EMVs using miRNeasy Mini kit (QIAGEN) according to manufacturer’s protocol. The miR-125a-5p cDNAs were synthesised using Hairpin-it miRs RT-qPCR kit (GenePharma, China) according to manufacturer’ protocols. The reaction conditions and gene primers for miR-125a-5p of real-time PCR were followed with our previous study.11The miR-125a-5p level in EMVs was calculated by using the absolute quantification analysis method. The miR-125a-5p standards with concentration of 1 pmol, 10 pmol, 0.1 nmol, and 1 nmol were measured under the same RT-qPCR condition, and the Ct values were sent to miR-125a-5p standard curve as following equation: y=–2.1467ln(x)+10.848, R2 =0.9955 x, y, respectively, represented the level of EMV-miR-125a-5p and cycle threshold of samples.
ECs culture and EMVs preparation
Human brain microvessel ECs were purchased (ScienCell, USA). Normal EMVs (n-EMVs) and oxygen and glucose deprivation EMVs (OGD-EMVs) were isolated from culture medium of normal or OGD treated ECs as we previously described,19 and miR-125a-5p overexpressed OGD EMVs (OGD EMVmiR-125a-5p) were obtained from culture medium of OGD treated miR-125a-5p overexpressed ECs as we previous described.11
Experimental animals
The male adult (8–10 weeks) C57BL/ 6 mice were purchased from the Animal Experiment Centre of Guangdong Province (Guangzhou, China) and housed in the Animal Care Facility at the Guangdong Medical University. Before and after surgery, mice were fed in a pathogen-free environment with free access to water and food on a 12-hour light/dark cycle.
Middle cerebral artery occlusion surgery and EMVs administration
IS mouse model was established by transient middle cerebral artery occlusion (tMCAO) surgery as we previously described.19 In brief, mice were anaesthetised, and maintained in a thermostat-controlled heating pad. A monofilament nylon suture was inserted into the lumen of internal carotid artery until resistance was felt. Two hours after tMCAO, the monofilament was drawn out. Buprenorphine (0.1 mg/kg, sc) and Carperofen (5 mg/kg, sc) were used to minimise the pain and discomfort. The mice (n=8) were randomly administrated with PBS (vehicle), Control EMVs, IS EMVs, n-EMVs, OGD-EMVs, or EMVmiR-125a-5p (1×10¹¹ particles/100 µL) in PBS via the tail vein. At 48 hours after tMCAO, the mice were used for various measurements, including cerebral blood flow (CBF), infarct volume, and Neurological Deficit Score (NDS). Mice with no infarct zone or with severe complications were excluded in this study.
Measurement of CBF
The CBF was measured by PeriCam PSI system as we previously described.19 In brief, mice were anaesthetised and a crossing incision was made on the head to expose the whole skull. CBF on the intact skull was observed under a PeriCam PSI system. The relative CBF was calculated using the formula: CBF of ipsilateral side/CBF of contralateral side×100%, and the mice with relative CBF ≤80% were included in this study.
Measurements of NDS and infarct volume
The NDS and infarct volume were detected by 5-point scale method and 2,3,5-triphenyltetranzolium chloride staining as we previously described.19
Statistical analysis
GraphPad Prism V.5 software and SPSS software V.19 was used to perform statistical analysis. Continuous variables were presented as the mean±SD. Comparisons for categorical characteristics were analysed by using χ2 test. Spearman’s rank correlation test or Pearson correlation test was used to analyse the comparisons for all proportions. The data normality was analysed by Kolmogorov-Smirnov test. The difference in EMVs and EMV-miR-125a-5p levels among Healthy control, At-risk subjects, and IS patients was analysed using Mann-Whitney test. Kruskal-Wally’s test was used to analyse the differences in EMVs and EMV-miR-125a-5p levels among different time of onset, infarct volume, severity and subtype of IS. Multivariate stepwise logistic regression analysis was used to assess the prediction of IS initiation. Data were presented as ORs and 95% CIs. Using ROC to assess diagnostic value of circulating EMVs, EMV-miR-125a-5p and their combined measurements in IS patients. A p<0.05 was considered statistically significant difference.
Results
General characteristics of subjects
As shown in table 1, there were no significant differences in age, gender, cholesterol, high-density lipoprotein, low-density lipoprotein (LDL) and uric acid among healthy controls, at-risk subjects and IS patients. The systolic blood pressure (SBP), Hcy and IMT were markedly higher in at-risk subjects and IS patients compared with healthy controls. The diastolic blood pressure (DBP) was higher in IS patients compared with healthy controls. The triglyceride (TG) was higher in at-risk subjects compared with healthy controls and IS patients.
EMVs isolation and characterisation
NTA and TEM analyses showed that the diameter of EMVs from healthy controls, at-risk subjects, and IS patients were ranged from 100 to 500 nm, and were in the shape of spherical membrane structure (figure 1A,B). Furthermore, we statistically analysed the size of EMVs from plasma of 10 participates and found that there were no statistically significant differences in size of EMVs isolated from normal control, at-risk subjects and IS patients (figure 1D). By western blot, we verified the expression of Annexin V as the special marker in isolated EMVs (figure 1C). As described, the efficiency of EMVs purification was analysed by fluorescence NTA. We found that higher percentages (80%) of EMVs were recovered by our isolation and purification methods (figure 1E), suggesting the majority of element we collected were EMVs.

Characterisation of EMVs. (A) The number and size of EMVs were detected by NTA. (B) The size and morphology of EMVs were detected by TEM, scare bar=100 nm. (C) Western blot was used to analyse the MVs-specific marker (annexin-V). (D) Analysis data of EMVs size in different group. (E) The efficiencies of the methods for purifying and detecting EMVs. EMVs, endothelial microvesicles; IS, ischaemic stroke; TEM, transmission electron microscopy.
RNA sequencing analysis of miRs in EMVs from IS patients
We performed microRNA (miR) array analysis to study the changes of miRs levels in plasma EMVs samples of three IS patients and three matched healthy control. As shown in figure 2, we found there are 104 miRs unregulated and 88 downregulated in EMVs from IS patients compared with that of the control subjects. MiR-1269b, miR-767–5 p, and miR-125a-5p levels showed markedly decreased in circulating EMVs from IS patients compared with healthy controls.
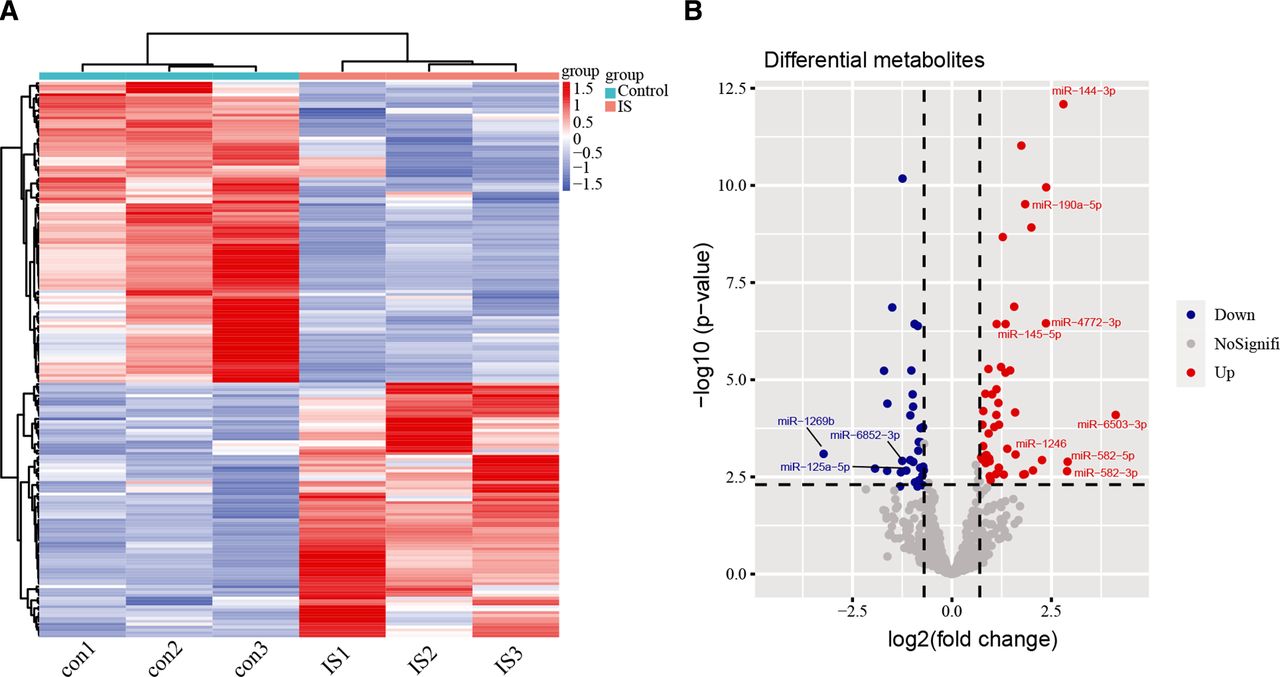
RNA sequencing results. (A) Heat map of differential MiRs expression by RNA sequence in healthy controls and is patients. (B) Volcano plot showing RNA sequencing results in healthy controls and is patients. The upregulated MiRs were signed as red dots, the downregulated MiRs were signed as green dots, and the grey dots represent an insignificant change.
The level of EMVs was significantly elevated, while EMV-miR-125a-5p was reduced in acute and chronic stage of IS
As shown in figure 3A, EMVs level in at-risk subjects and IS patients were significantly higher, while EMV-miR-125a-5p level was markedly lower than normal control (EMVs: IS vs normal control: p<0.01; at-risk subjects vs normal control: p<0.05; EMV-miR-125a-5p: IS vs normal control: p<0.01; at-risk subjects vs normal control: p<0.01, figure 3A,B), with the highest EMVs and lowest EMV-miR-125a-5p level in IS patients group (EMVs: IS vs at-risk subjects: p<0.05; EMV-miR-125a-5p: IS vs at-risk subjects: p<0.05, figure 3A,B).
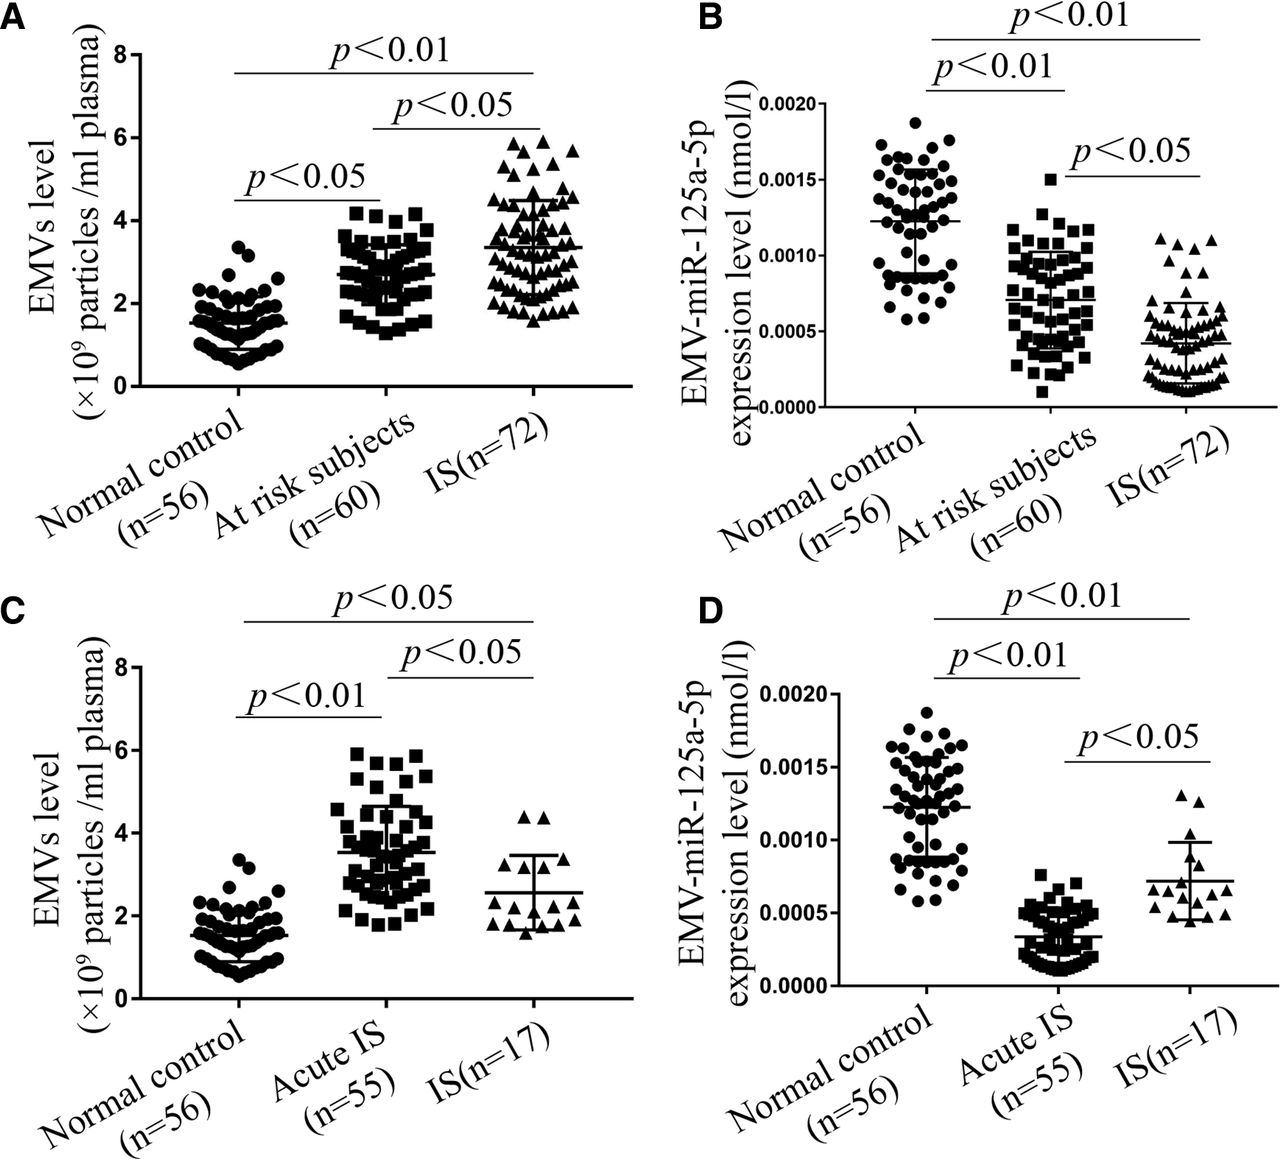
EMVs levels were significantly elevated, while EMV-miR-125a-5p levels were markedly decreased in at-risk subjects and IS patients. (A, B) EMVs and EMV-miR-125a-5p levels in normal controls, at-risk subjects and IS patients. (C, D) EMVs and EMV-miR-125a-5p levels in normal control, acute and chronic IS patients. (Data are presented as mean±SD). EMVs, endothelial microvesicles; IS, ischaemic stroke.
For patients in different stage of IS, EMVs levels were increased 1.92-fold and 1.57-fold in acute stage and chronic stage compared with normal control, respectively, and was 1.2-fold higher in acute stage compared with chronic stage (acute vs normal control: p<0.01; chronic vs normal control: p<0.05; acute vs chronic: p<0.05, figure 3C). EMV-miR-125a-5p levels were reduced nearby 95% and 29% in acute stage compared with normal control and chronic stage, respectively (acute vs normal control: p<0.01; acute vs chronic: p<0.05, figure 3D). In addition, EMV-miR-125a-5p level was reduced nearly 52% in chronic IS compared with normal control (chronic vs normal control: p<0.01, figure 3D). Our results demonstrated that increased level of EMVs and decreased level of EMV-miR-125a-5p might help distinguish acute IS from normal control and at-risk subjects.
The levels of EMVs and EMV-miR-125a-5p were correlated with carotid plaque and remodeling in is patients
Compared with healthy controls, the at-risk subjects and IS patients were higher in carotid atherosclerosis plaque rates and carotid IMT value (table 1). In IS patients, EMVs level was 1.24-fold higher, while EMV-miR-125a-5p level was 42% lower in patients with carotid plaque than those without carotid plaque (EMVs: IS w/ CP vs IS w/o CP: p<0.05; EMV-miR-125a-5p: IS w/ CP vs IS w/o CP: p<0.01, figure 4A,B). In addition, a positive correlation was observed between EMVs level and carotid IMT value by spearman’s rank correlation analysis (r=0.422, p<0.01, figure 4C), and there was a negative correlation between EMV-miR-125a-5p level and carotid IMT value (r=−0.303, p<0.05, figure 4D).

EMVs and EMV-miR-125a-5p levels were correlated with carotid plaque (CP) and IMT. (A, B) The level of EMVs was increased, while EMV-miR-125a-5p was decreased in is patients with (w/CP). (C, D) The level of EMVs was positively, while EMV-miR-125a-5p was inversely associated with IMT. (Data are presented as mean±SD). EMVs, endothelial microvesicles; IMT, intimamedia thickness; w/CP, with CP; w/o CP, without CP.
EMVs was positively, while EMV-miR-125a-5p level was negatively correlated with NIHSS scores and lesion volume
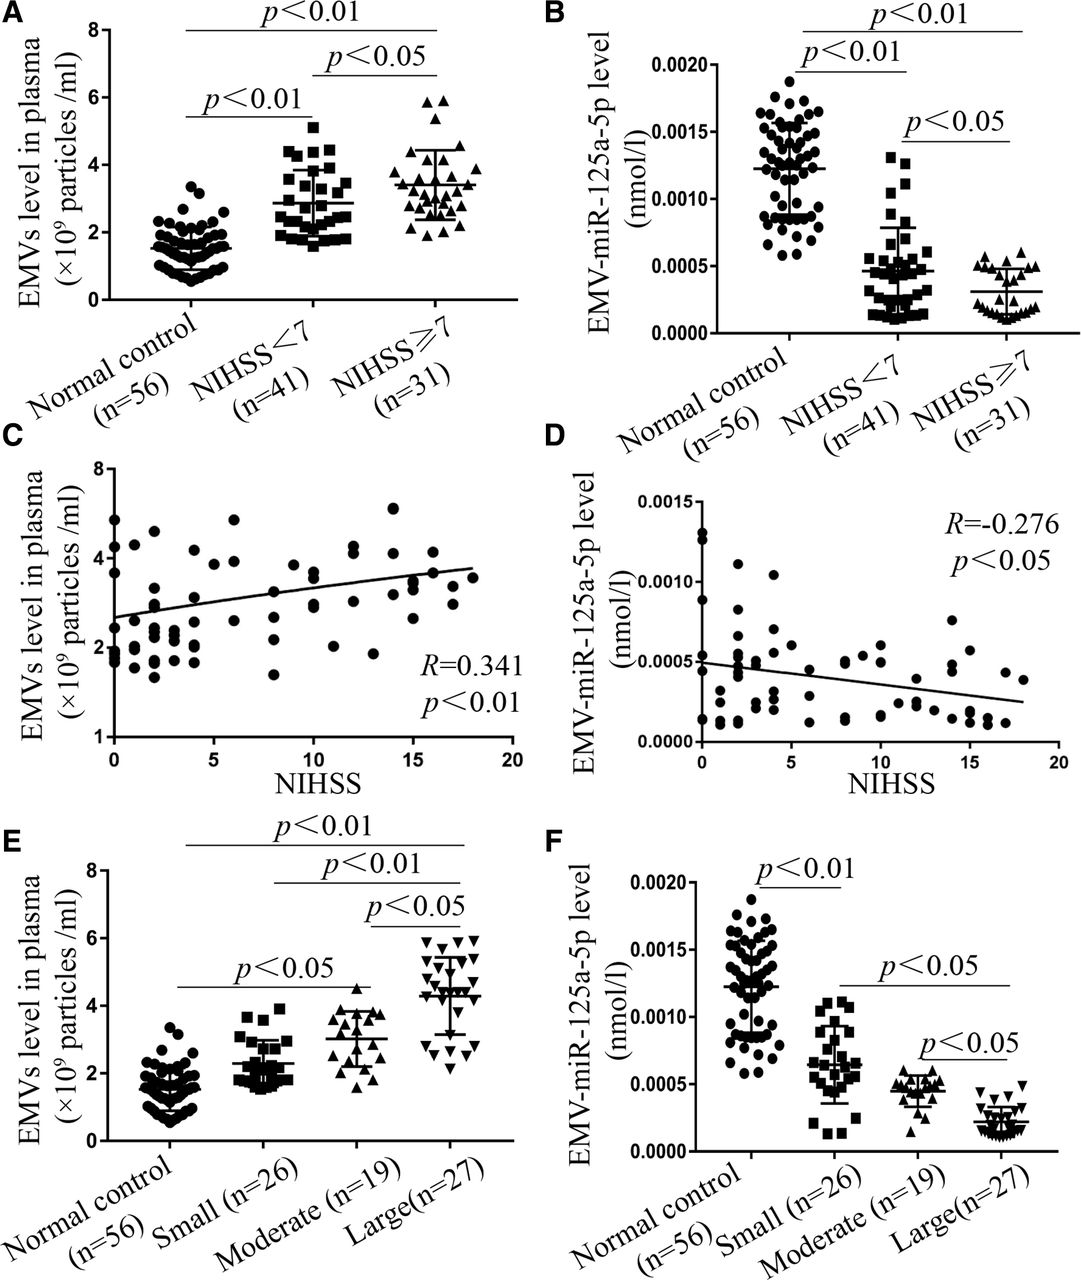
We found that EMVs level was 1.44-fold and 1.87-fold higher in minor-severe group (NIHSS <7) and moderate-to-severe group (NIHSS ≥7) than that in healthy controls, and was 1.2-fold in moderate-to-severe group higher than that in minor-severe group (minor-to-severe vs normal control: p<0.01; moderate-to-severe vs normal control: p<0.01; moderate-to-severe vs minor-to-severe: p<0.05, figure 5A). By Pearson correlation test, we found that EMV level was positively associated with NIHSS score (r=0.341, p<0.01, figure 5C). In contrast, EMV-miR-125a-5p levels were reduced by 60.1% and 78.7% in minor-to-severe group and moderate-to-severe group than that in normal control, and was decreased by 32.9% in moderate-to-severe group than that in minor-severe group (minor-to-severe vs normal control: p<0.01; moderate-to-severe vs normal control: p<0.01; moderate-to-severe vs minor-to-severe: p<0.05, figure 5B). EMV-miR-125a-5p level was inversely related to NIHSS score (r=−0.276, p<0.05, figure 5D).

EMVs level was positively, while EMV-miR-125a-5p level was negatively correlated with NIHSS scores and lesion volume. (A, B) EMVs levels were increased, while EMV-miR-125a-5p levels were decreased in minor-to-severe (NIHSS <7) and moderate-to-severe (NIHSS ≥7) is patients. (C, D) EMVs level was positively; while EMV-miR-125a-5p level was negatively correlated to NIHSS score of is patients. (E, F) The level of EMVs was elevated, while the level of EMV-miR-125a-5p was reduced in small, moderate and large infarct volume of is patients, and the large group was the most pronounced. (Data are presented as mean±SD). EMVs, endothelial microvesicles; NIHSS, National Institutes of Health Stroke Scale.
In figure 5E,F, EMVs levels were markedly increased in large and moderate infarct groups compared with healthy controls. Specifically, EMVs level in large and moderate infarct group was 1.84-fold and 1.38-fold higher than that in normal control group, respectively (large vs normal control: p<0.01; moderate vs normal control: p<0.05, figure 5E), and EMVs level in large infarct group was 1.33-fold higher than that in moderate infarct group (large vs moderate: p<0.05, figure 5E). According to Pearson correlation test, EMVs level was positively related to the lesion volume of IS. Conversely, EMV-miR-125a-5p level was negatively related to the lesion volume of IS. EMV-miR-125a-5p level in large and moderate infarct group was decreased by 76.6% and 54.4% than that in normal control group (large vs normal control: p<0.01; moderate vs normal control: p<0.01, figure 5F), and EMV-miR-125a-5p level in large infarct group was decreased by 45.6% than that in moderate group (large vs moderate: p<0.05, figure 5F).
Overall, these findings indicated that EMVs/EMV-miR-125a-5p level was highly correlated with the severity of IS.
EMVs and EMV-miR-125a-5p levels were significantly changed in LAA and CE subgroups
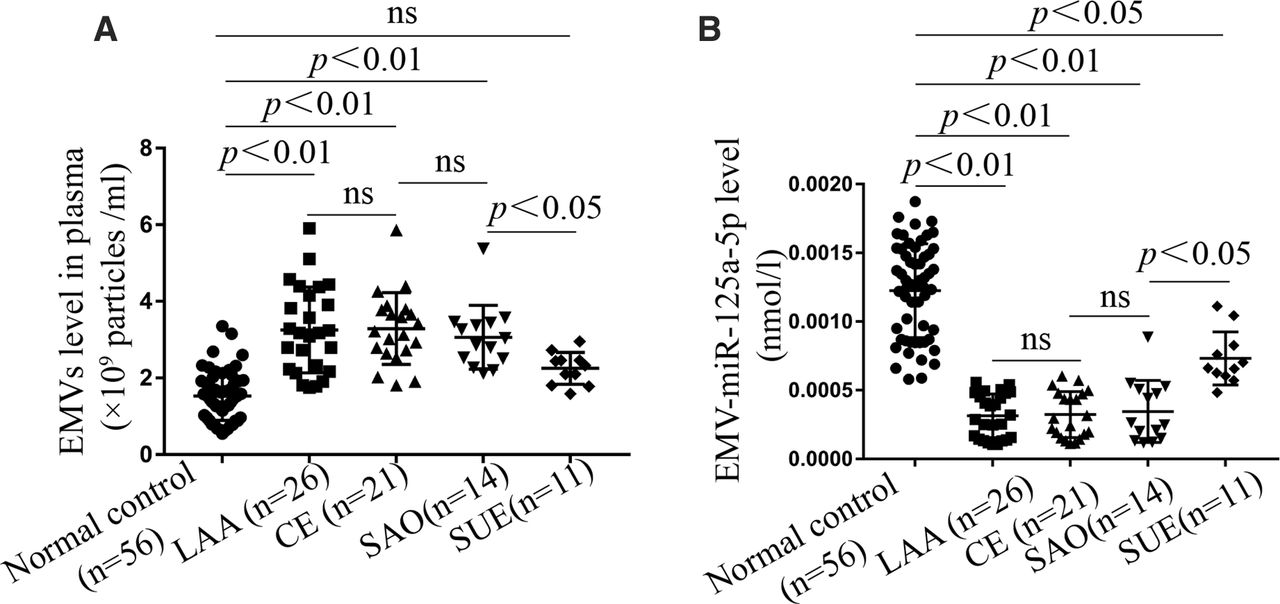
As shown in figure 6, EMVs level was varied in different IS subgroups. EMVs levels were significantly increased in LAA, CE and SAO subgroups (vs normal control: p<0.01, figure 6A), and was especially high in LAA and CE subgroups (LAA vs CE: p>0.05, figure 6A). There was no significance in EMVs level between SUE subgroup and normal control group (SUE vs normal control: p>0.05, figure 6A). In addition, EMV-miR-125a-5p levels were markedly decreased in LAA and CE subgroups (vs normal control, p<0.01, figure 6B). There was no significance in the level of EMV-miR-125a-5p between LAA subgroup and CE subgroup (LAA vs CE: p>0.05, figure 6B).

EMVs and EMV-miR-125a-5p levels were related to different is subgroups. (A) EMVs levels were markedly increased in LAA and CE subgroups of IS patients. (B) EMV-miR-125a-5p levels were obviously decreased in LAA and CE subgroups of IS patients. (Data are presented as mean±SD). CE, cardioembolism; EMV, endothelial microvesicle; IS, ischaemic stroke; LAA, large artery atherosclerosis; ns, not significant; SAO, small artery occlusion; SUE, stroke of undetermined cause.
EMVs and EMV-miR-125a-5p levels were independent risk factors and potential predictors for IS
As shown in table 2, we found that the levels of EMVs (OR 2.819, 95% CI 1.458 to 5.451), EMV-miR-125a-5p (OR=0.0014, 95% CI 0.00024 to 0.0021), SBP (OR 1.017, 95% CI 1.001 to 1.033), Hcy (OR 1.047, 95% 1.023 to 1.072), TG (OR 0.039, 95% CI 0.388 to 0.976) and DBP (OR 1.043, 95% CI 1.010 to 1.077) were highly correlated with IS. Further study, logistic stepwise regression analysis was performed to assess the value of these factors for IS. We observed that circulating EMVs and EMV-miR-125a-5p were independent risk factors for IS and more significant in comparison with SBP, Hcy, TG and DBP.
Multivariate logistic regression between risk factors and IS
ROC curve analysis result showed that the AUCs were 0.720 (95% CI 0.611 to 0.829, p<0.001) and 0.832 (95% CI 0.758 to 0.907, p<0.001), respectively, for EMVs and EMV-miR-125a-5p (figure 7, table 3). In addition, combined assessment of EMVs and EMV-miR-125a-5p levels could increase the AUC to 0.881 (95% CI 0.827 to 0.935, p<0.001) (figure 7, table 3). The specificity was 63% and 82.5, respectively, for EMVs and EMV-miR-125a-5p (figure 7, table 3). Combined assessment of EMVs and EMV-miR-125a-5p levels could increase the specificity to 89.7% (figure 7, table 3). The results suggested that circulating EMVs and EMV-miR-125a-5p were sensitive biomarkers for IS diagnosis. EMV-miR-125a-5p was more specificity and displayed better diagnostic value than EMVs. Moreover, EMVs combined with EMV-miR-125a-5p exerted the best diagnostic value.
Area of under curve (AUC), cut-off value, sensitivity, specificity, Yonden Index for EMVs and EMV-miR-125a-5p in IS

The receiver operating characteristic (ROC) curves representing IS diagnostic tests with EMVs and EMV-miR-125a-5p. The ROC curve for EMVs and EMV-miR-125a-5p exhibits an AUC of 0.720 and 0.832, respectively. Area under ROC curves (AUC) of their combination was 0.881. The specificity of EMVs, EMV-miR-125a-5p and their combination were 63%, 82.5% and 89.7%, respectively. EMVs, endothelial microvesicles.
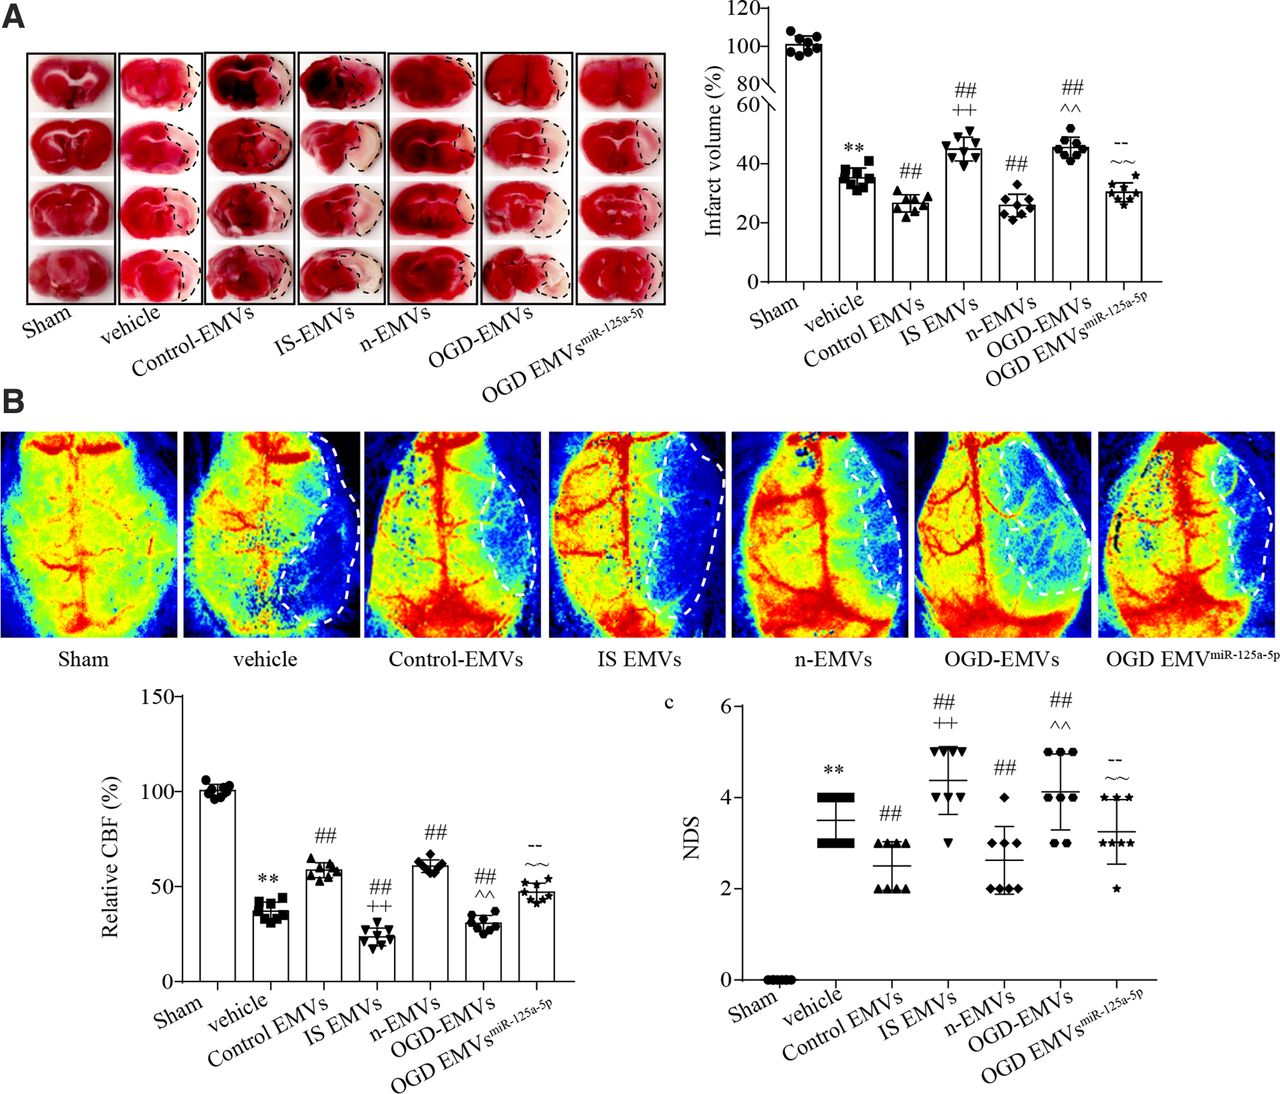
As shown in figure 8, control EMVs or n-EMVs administration could decrease the infarct volume and NDS, while increase the CBF of IS mice compared with vehicle group (vs vehicle; p<0.01; figure 8A–C) after tMCAO treatment. On the contrary, IS EMVs or OGD-EMVs administration aggravated the tMCAO induced ischaemic injury by increasing infarct volume and NDS, while decreasing CBF (vs vehicle; p<0.01; figure 8A–C). In addition, we observed that OGD EMVmiR-125a-5p could decrease infarct volume and NDS, while increase CBF of IS mice compared with OGD EMVs or IS EMVs (vs IS EMVs or OGD EMVs; p<0.01; figure 8A–C). These data indicated that EMVs from normal or ischaemic condition exerted diverse effects on the progress of stroke, and miR-125a-5p was an important functional cargo in EMVs, which can reduce the detrimental roles of ischaemic EMVs on IS.
Effects of EMVs and their carried miR-125a-5p on infarct volume, NDS and CBF. (A) Representative images and summary data of infarct size in different groups. (B) The representative images and analysis data of CBF in different groups. (C) NDS in different groups. (**p<0.01 vs sham; ##p<0.01 vs vehicle; ++p< 0.01 vs control EMVs; p<0.01 vs n-EMVs; -- p< 0.01 vs. is EMVs; ~~ p< 0.01 vs OGD EMVs). CBF, cerebral blood flow; EMVs, endothelial microvesicles; NDS, Neurological Deficit Score.
Discussion
In this clinic study, we found that EMVs was remarkably increased in the acute stage of IS, and positively related to carotid IMT, NIHSS and infarct volume, while their carried miR-125a-5p was obviously reduced in the acute IS stage, and negatively related to carotid IMT, NIHSS and infarct volume. They were also found to be associated with the subtypes of IS. In addition, the EMVs and their carried miR-125a-5p could serve as independent risk factors and to have the value as diagnostic biomarkers for IS, and combination of them displayed better diagnostic value.
EMVs are directly shedding from the plasma membrane of ECs on activation or apoptosis,20 which contain endothelial proteins such as CD62E, CD31, CD54, CD105, CD146, Annexin V and CD144.21 Isolation and identification of EMVs relies on the use of these specific markers. However, except CD62E and CD144, most of them lack exclusive endothelial expression. CD31 is present on activated platelets and their derived MV; CD146 is present on activated T-cells; CD105 has been found on mesenchymal stromal cells and activated monocytes/macrophages.21 Of note, CD144 was proposed as one of the most specific markers for EMVs detection.22 Since one surface antigen CD105 expression cannot define EMVs specifically, we applied the surface antigen CD144 conjugated to Q-dots to simultaneously label the microbeads captured MVs in this study.12 EMVs level could reflect the status of ECs, and has been served as a marker of various cardiovascular and cerebrovascular diseases, such as hypertension,23 atherosclerosis,24 and coronary artery disease.25 In this study, we found that EMVs levels were elevated in IS patients, especially in the acute IS stage, suggesting the increasing secretion of EMVs from ECs under ischaemic injury. This is in line with a previous study indicated that EMVs levels were increased in various vascular disease caused by ECs dysfunction, including atherosclerosis, thrombosis and diabetes.26 Acute IS can induce a cascade of events including oxidative stress, inflammation, and reduced endothelial and neural trophic support.27 During the acute IS stage, the excess oxidative stress in cerebral microvessels and brain microenvironment lead to EC apoptosis and vascular injury.28 In addition, following acute ischaemia, the proinflammatory and anti-inflammatory cytokines lost balance in the brain, which can also induce endothelial and neural injury.29 There is evidence demonstrated that oxidative stress and inflammation could promote the secretion of MVs from ECs.30 In this study, the increased level of EMVs may be correlated with the severe EC injury induced by oxidative stress and inflammation at the acute IS stage. Meanwhile, the level of EMVs was elevated in middle and large infarct volume, and was positively associated with the severity of IS. These results were consisting with a previous study showing that EMVs (diameter: 0.05–1 µm) levels were increased and associated with the severity and lesion volume of IS which was detected by flow cytometry.31 In addition, we also observed that there were multiple types of EMVs, with different diameters. However, whether EMVs with different diameters exert different roles in stroke are still unknown, which will be investigated in our future research work. Our study added new evidence to the role of membrane vesicles from ECs as possible biomarkers for IS.
It is well known that large infarct volume and serious IS are correlated with more severe EC oxidative stress and inflammation,32 which can help to interpret our finding of more EMVs secretion. This study, we found that EMVs levels were increased in LAA, CE and SAO subgroups of IS patients, with the highest in LAA subgroup. The LAA of IS has been proved to be associated with higher vascular oxidative stress and inflammation than CE and SAO subgroups, and patients with LAA displayed more severe endothelial dysfunction.33 Oxidised LDL (ox-LDL) is a biomarker and risk factor in many acute inflammatory diseases. High level of ox-LDL is found in LAA subgroup in acute IS patients and associated with high risk of death and poor recovery.34 Our results showed that LAA had the highest level of EMVs, indicating severe EC injury under oxidative stress and inflammation. Of note, increased carotid IMT and carotid plaque are important risk factors for acute IS. The increased carotid IMT is usually related to inflammatory cell infiltration, extracellular matrix remodelling and vascular smooth muscle cells activation. Inflammatory cell invasion and inflammatory activities can lead to EC dysfunction and promote the accumulation of lipid, platelet and releases of various inflammatory cytokines, which further accelerate the formation of carotid plaque.35 The pathological development of carotid IMT and carotid plaque includes the inward hyperplasia and plaque outward hyperplasia of the carotid artery leading to stenosis or occlusion of carotid, which results in thrombosis and IS.36 Our data showed that IS patients with carotid plaque had increased EMVs than those without carotid plaques, and the level of EMVs was positively correlated with the carotid IMT value.37 These findings indicate that high level of EMVs may correlate with carotid remodelling and predict the risk of IS. Taken together, our finding suggested that the high level of EMVs could serve as a promising biomarker for acute IS with severe injury, LAA subgroup, and increased carotid IMT.
Circulating miRs could serve as predictors for various vascular diseases. It is believed that MVs are the major transport vehicles for distinct miRs in circulation. MVs are comprised of lipid bilayers that can prevent the packaged miRs from RNases induced degradation, and could stably and accurately reflect the status of the source cells.38 Moreover, miRs are important functional contents in EMVs, and the category and amount of miRs in EMVs are highly related to the status of ECs. We previously reported that EMVs derived from ECs under normal or OGD condition exerted diverse roles in blood–brain barrier (BBB) disruption and cerebral ischaemic injury.19 Specifically, EMVs derived from ECs under normal condition ameliorated, while EMVs derived from ECs under OGD condition aggravated BBB disruption and cerebral ischaemic injury. Another report demonstrated that EMVs derived from ECs cultured in high glucose condition contained lower level of miR-126 and exerted decreased endothelial repair capacity.39 There is evidence demonstrated that the decreased miR-126 in circulating EMVs might associate with the occurrence of coronary artery disease.3 Therefore, EMVs and their carried miRs are of important valuable for the prediction of vascular diseases. However, the relationships of EMVs and their carried miRs to IS have been rarely reported.
By miRs microarray assay, we screened out that miR-125a-5p was obviously decreased in EMVs from IS patients. MiR-125a-5p is a brain-enriched miR, and has been proved to exert critical role in protecting brain endothelial barrier function.40 Our previous study showed that EMVs from ECs under serum deprivation treatment exerted beneficial roles in ECs by transferring their carried miR-125a-5p,11 suggesting miR-125a-5p is a functional cargo in beneficial EMVs. This study, we found that miR-125a-5p level in EMVs was markedly decreased in IS patients, which is consistent with a previous study showing the low circulating miR-125a-5p level in the peripheral blood of IS rats.10 Furthermore, we found that miR-125a-5p level in EMVs was lowest in the acute stage of IS, and was negatively associated with NIHSS scores and infarct volume. MiR-125a-5p implicated in regulating multiple vascular functions. Decreased miR-125a-5p level was observed in the aorta of stroke-prone SHR and in the blood of IS mice.10 Chen et al reported that miR-125a-5p involved in lipid uptake and contributed to reducing IL-2, TNF-a, IL-6 and TGF-β1 secretion in ox-LDL treated macrophages.41 A previous study has proved that miR-125a-5p exerted protective effect on ox-LDL induced ECs dysfunction by reducing cell oxidative stress.15 As stated above, acute severe IS is correlated to high levels of vascular oxidative and inflammation.28 Our result showing the lowest EMV-miR-125a-5p level in the acute stage and severe IS can be interpreted as the pathophysiological characters of IS. Moreover, oxidative stress and inflammation induced vascular EC dysfunction has been proved to be the pathological basis of vascular remodelling, which contribute to the formation of atherosclerotic plaque. In this study, we observed that EMV-miR-125a-5p level was lower in IS patients with carotid plaques than those without, and was negatively related to carotid IMT. These data indicate that EMV-miR-125a-5p level might be associated with vascular remodelling and the formation of carotid plaque. This is supported by a previous study showing that miR-125a-5p level is reduced in the coronary arteries with atherosclerotic plaque.42
To further claim EMVs and their carried miR-125a-5p are closely related with the occurrence, progress of IS, we carried out experiments to check the roles of EMVs and their carried miR-125a-5p in IS mouse model. We found that Control EMVs or n-EMVs administration could decrease the infarct volume and NDS, while increase the CBF of IS mice compared with vehicle group, while IS EMVs or OGD-EMVs administration aggravated the tMCAO induced ischaemic injury (increasing infarct volume and NDS, decreasing CBF). In addition, we observed that OGD EMVmiR-125a-5p could decrease infarct volume and NDS, while increase CBF of IS mice compared with OGD EMVs or IS EMVs. Our finding indicating that EMVs from normal or ischaemic condition exerted diverse effects on the progress of stroke, which is consisted with our previous study showing that EMVs derived from ECs under normal condition ameliorated, while EMVs derived from ECs under OGD condition aggravated BBB disruption and cerebral ischaemic injury.19 Moreover, we verified that miR-125a-5p can reduce the detrimental role of ischaemic EMVs on IS, which was supported by a previous study shown that miR-125a-5p exerted protective role in brain endothelial barrier function,40 and in line with our previous study showed that EMVs exerted protective effects on ECs by transferring their carried miR-125a-5p.11 These evidence highlighted that the function and cargos of MVs are highly rely on the status of the source cells.43 Furthermore, lower level of EMV-miR-125a-5p might be also correlated with the inflammation, apoptosis and oxidative stress. Thus, further investigation is needed to explore the precise mechanisms that EMVs and EMV-miR-125a-5p implicated in IS occurrence and development.
In this study, we also observed that circulating EMVs and EMV-miR-125a-5p are more independent and significant risk factors for IS when compared with SBP, Hcy and DBP which are commonly elevated in IS patients and have been proved to be risk factors for IS.44 Furthermore, the ROC curve analysis demonstrated that the AUCs for circulating EMVs and EMV-miR-125a-5p were 0.720 and 0.832, respectively, and the AUC of circulating EMVs combined with EMV-miR-125a-5p was 0.881, indicating their predictor values of them for IS. The diagnostic specificity of circulating EMVs, EMV-miR-125a-5p levels and EMVs combined with EMV-miR-125a-5p was 63%, 82.5% and 89.7%, respectively. Since other reported circulating miRs have the diagnostic specificity range from 30% to 70% for IS,45 the levels of EMVs and EMV-miR-125a-5p may offer better diagnostic specificity for IS.
Conclusions
Our findings suggest that circulating EMVs and their contained miR-125a-5p are closely associated with the occurrence, progress, subtypes and severity of IS, and could serve as promising biomarkers for IS. Nevertheless, further studies are needed to evaluate their efficacies in larger multicentre clinical trials.
Supplemental material
Data availability statement
All data relevant to the study are included in the article or uploaded as online supplemental information.
Ethics statements
Patient consent for publication
Ethics approval
The research protocol was approved by the ethics committee in the Affiliated Hospital of Guangdong Medical University (PJ2020-034), and all participants signed the written informed consent according to the 1964 Declaration of Helsinki and its later amendments or comparable ethical standards.
References
Supplementary material
Supplementary Data
This web only file has been produced by the BMJ Publishing Group from an electronic file supplied by the author(s) and has not been edited for content.
Footnotes
XM, XL and JL contributed equally.
XY and QP contributed equally.
Contributors XM, XL, YW, XW, JL and QP performed experiments; QP, XM, YC, XL and XY wrote the manuscript; XM, XL, YW, XW, JL and QP contributed to manuscript preparation; all authors discussed the results, analysed data and commented on the manuscript; QP, YC, XY and XM developed the concepts and designed the study. All authors read and approved the final manuscript. XM is responsible for the overall content as the guarantor.
Funding This work was supported by National Natural Science Foundation of China (NSFC, 81770500, 81870580); Guangdong Basic and Applied Basic Research Foundation (2019A1515011574, 2020A1515010089, 2021A1515010982).
Competing interests None declared.
Provenance and peer review Not commissioned; externally peer reviewed.
Supplemental material This content has been supplied by the author(s). It has not been vetted by BMJ Publishing Group Limited (BMJ) and may not have been peer-reviewed. Any opinions or recommendations discussed are solely those of the author(s) and are not endorsed by BMJ. BMJ disclaims all liability and responsibility arising from any reliance placed on the content. Where the content includes any translated material, BMJ does not warrant the accuracy and reliability of the translations (including but not limited to local regulations, clinical guidelines, terminology, drug names and drug dosages), and is not responsible for any error and/or omissions arising from translation and adaptation or otherwise.