Article Text

Abstract
Objective To explore the correlations of high-density lipoprotein cholesterol (HDL-C)/low-density lipoprotein cholesterol (LDL-C) with myocardial infarction (MI), all-cause mortality, haemorrhagic stroke and ischaemic stroke, as well as the joint association of genetic susceptibility and HDL-C/LDL-C with the MI risk.
Methods and results This study selected 384 093 participants from the UK Biobank (UKB) database. First, restricted cubic splines indicated non-linear associations of HDL-C/LDL-C with MI, ischaemic stroke and all-cause mortality. Second, a Cox proportional-hazards model indicated that compared with HDL-C/LDL-C=0.4–0.6, HDL-C/LDL-C<0.4 and >0.6 were correlated with all-cause mortality (HR=0.97 for HDL-C/LDL-C<0.4, 95% CI=0.939 to 0.999, p<0.05; HR=1.21 for HDL-C/LDL-C>0.6, 95% CI=1.16 to 1.26, p<0.001) after full multivariable adjustment. HDL-C/LDL-C<0.4 was correlated with a higher MI risk (HR=1.36, 95% CI=1.28 to 1.44, p<0.05) and ischaemic stroke (HR=1.12, 95% CI=1.02 to 1.22, p<0.05) after full multivariable adjustment. HDL-C/LDL-C>0.6 was associated with higher risk haemorrhagic stroke risk after full multivariable adjustment (HR=1.25, 95% CI=1.03 to 1.52, p<0.05). Third, after calculating the coronary heart disease Genetic Risk Score (CHD-GRS) of each participant, the Cox proportional-hazards model indicated that compared with low CHD-GRS and HDL-C/LDL-C=0.4–0.6, participants with a combination of high CHD-GRS and HDL-C/LDL-C<0.4 were associated with the highest MI risk (HR=2.45, 95% CI=2.15 to 2.8, p<0.001). Participants with HDL-C/LDL-C<0.4 were correlated with a higher MI risk regardless of whether they had a high, intermediate or low CHD-GRS.
Conclusion In UKB participants, HDL-C/LDL-C ratio of 0.4–0.6 was correlated with lower MI risk, all-cause mortality, haemorrhagic stroke and ischaemic stroke. Participants with HDL-C/LDL-C<0.4 were correlated with a higher MI risk regardless of whether they had a high, intermediate or low CHD-GRS. The clinical significance and impact of HDL-C/LDL-C need to be further verified in future studies.
- risk factors
- prospective studies
- cerebrovascular disorders
- cerebrovascular circulation
- mortality
Data availability statement
Data are available in a public, open access repository. Data are available on reasonable request and with the permission of the UK Biobank.
This is an open access article distributed in accordance with the Creative Commons Attribution Non Commercial (CC BY-NC 4.0) license, which permits others to distribute, remix, adapt, build upon this work non-commercially, and license their derivative works on different terms, provided the original work is properly cited, appropriate credit is given, any changes made indicated, and the use is non-commercial. See: http://creativecommons.org/licenses/by-nc/4.0/.
Statistics from Altmetric.com
WHAT IS ALREADY KNOWN ON THIS TOPIC
The high-density lipoprotein cholesterol (HDL-C)/low-density lipoprotein cholesterol (LDL-C) ratio is an excellent cardiovascular disease predictor. The relationships between HDL-C/LDL-C and myocardial infarction (MI), all-cause mortality, and ischaemic and haemorrhagic stroke need to be further investigated.
WHAT THIS STUDY ADDS
HDL-C/LDL-C ratio of 0.4–0.6 was correlated with lower MI risk, all-cause mortality, haemorrhagic stroke and ischaemic stroke. Participants with HDL-C/LDL-C<0.4 were correlated with a higher MI risk regardless of whether they had a high, intermediate or low coronary heart disease-Genetic Risk Score.
HOW THIS STUDY MIGHT AFFECT RESEARCH, PRACTICE OR POLICY
The results of this study may provide guidance and clinical practice information for rational control of lipid, thereby preventing cardiovascular adverse events in the future.
Introduction
Cardiovascular disease (CVD) is the leading cause of death, and can also induce disability, illness and poor life quality.1 High-density lipoprotein cholesterol (HDL-C) is an indicator of metabolic syndrome.2 The current concept of HDL-C for CVD risk prevention is based on many preclinical and epidemiological data, and HDL-C has an inverse association with CVD risk.3 However, recent studies have found people with extremely high HDL-C levels can have either enhanced cardiovascular and death risks or a tendency toward this.4 5 Low-density lipoprotein cholesterol (LDL-C) is a CVD risk factor.6 3-hydroxy-methylglutaryl-coA reductase inhibitors (statins), which can reduce LDL-C and change HDL-C/LDL-C ratio, have been widely applied for prevention of stroke and coronary artery disease.7 The HDL-C/LDL-C ratio, a CVD predictor, reflects the protective and atherogenic lipoprotein balance.8 The relationships between HDL-C/LDL-C and myocardial infarction (MI), all-cause mortality, haemorrhagic stroke and ischaemic stroke need to be further investigated.
In addition, both environmental and genetic factors contribute to MI development,9 and genetically predetermined elevated CVD risk can be at least partially offset by a healthy lifestyle.10 However, the interaction between HDL-C/LDL-C and genetic susceptibility to MI remains unclear.
The aim of this study was to determine the associations of HDL-C/LDL-C with MI, all-cause mortality and haemorrhagic and ischaemic stroke in order to identify an appropriate HDL-C/LDL-C ratio. We also aimed to explore the joint associations of genetic susceptibility and HDL-C/LDL-C with MI, and to further explore potential genetic HDL-C/LDL-C interactions.
Methods
Study population
The UK Biobank (UKB) is the largest biomedical sample database in the world and contains data of more than 500 000 volunteers, which was approved by Northwest Multicentre Research Ethics Committee, and all participants agreed to participate.11 12 Data from the UKB are available to researchers after receiving research approvals from the UKB. This study was conducted under UKB licence (Application ID:62017).
Participants with incomplete data records (genetic data, HDL-C, LDL-C, triglycerides (TG), blood pressure, blood glucose (BG) or body mass index (BMI)) or diagnosed disease records (haemorrhagic and ischaemic stroke or MI) were excluded from the study.
Other baseline data, including on race, smoking history, education level, alcohol use and Townsend Deprivation Index (TDI) (the missing data rates of 0.5%,0.18%, 1.16%, 0.24% and 0.12%, respectively), were missing due to the participants being unwilling to answer the applicable questions. Therefore, to avoid the data not being completely consistent with the real participant data after multiple interpolation, multiple interpolation was not adopted. The study finally included 384 093 participants.
Ascertainment of basic characteristics and outcomes
According to the UKB (https://www.ukbiobank.ac.uk), the basic characteristics of each participant were primarily identified using registration records. Follow-up occurred from the registration date to the time of CVD diagnosis (algorithmically defined outcomes), death register or final follow-up time (February 2021), whichever occurred first. The outcomes were all-cause mortality, haemorrhagic stroke, ischaemic stroke and MI.
Definition of Genetic Risk Score
Regarding quality control, the input procedures and genotypes of participants included in the UKB have been described previously.13 In this study, newly discovered loci from the UKB were not included in order to reduce false positives. Independent single-nucleotide polymorphisms (SNPs) had significant associations with coronary heart disease (CHD), and 68 were selected in this study.14 15 The effect size (b coefficient) of SNPs was derived from their GWAS (Genome-wide association study) result (only 67 SNPs had b coefficients).16 Online supplemental file 1 shows the selected SNPs. For each individual included in the UKB, a Genetic Risk Score (GRS) was determined from previously published findings.17 Using this method, each participant was considered low (quintile 1), intermediate (quintiles 2–4), or high (quintile 5) CHD-GRS.
Supplemental material
Statistical analyses
Comparisons of baseline characteristics between the non-survival and survival groups were performed using the appropriate chi-square test. Continuous variables are shown as mean±SD or median±IQR.
The non-linear relationships between LDL-C, HDL-C, and HDL/LDL-C and different adverse events were analysed using restricted cubic splines (RCS), and adjusted for TDI, race, age, gender, smoking history, alcohol use, education level, BG, BMI, systolic blood pressure (SBP), diastolic blood pressure (DBP) and TG.
Based on the RCS, we further divided the HDL-C/LDL-C ratios into three groups: <0.4, 0.4–0.6 and>0.6. The HRs and 95% CIs were approximated using a Cox proportional-hazards model. Model 1 was unadjusted to assess the correlation between different HDL/LDL groups and all-cause mortality and the CVD (haemorrhagic and ischaemic stroke or MI) risk without adjusting for confounding factors. Model 2 was adjusted for gender and age to assess whether the correlation between different HDL/LDL groups and the CVD (haemorrhagic and ischaemic stroke or MI) risk and all-cause mortality was independent of gender and age. Model 3 was adjusted for TDI, race, age, gender, BG, BMI, TG, DBP, SBP, alcohol use, smoking history and education level. The objective of model 3 was to assess whether the correlation between different HDL/LDL groups and the all-cause mortality and the CVD (MI, ischaemic stroke or haemorrhagic stroke) risk was independent of sociodemographic, economic (TDI) and other cardiovascular risk factors.
The HRs for MI, all-cause mortality and ischaemic and haemorrhagic stroke among different HDL-C/LDL-C groups were estimated using a Cox proportional-hazards model according to the subgroups of age and gender. Middle age was defined as 40–59 years, and old age was defined as 60 years and older.18 We applied a subgroup analysis with 60 years old as the boundary age. Model 1 was adjusted for race, TDI, age, smoking history, education level, alcohol use, BMI, BG, SBP, DBP and TG. Model 2 was the same as model 1 with the addition of adjustment for gender.
The joint correlation between different HDL/LDL groups and CHD-GRS for MI risk was estimated using a Cox proportional-hazards model. The multivariable model was adjusted for race, age, TDI, gender, smoking history, alcohol use, education level, BG, BMI, SBP, DBP and TG.
At each step of the statistical analysis, the statistical model automatically identified and excluded participants with missing variables. Therefore, our statistical results were based on a complete-case analysis of the participants.
All the data were analysed using R software (V.4.1.0). A p<0.05 was considered statistically significant.
Results
Basic characteristics between the survival and non-survival groups
The study finally included 384 093 participants. The median follow-up time was 11.91 years, and the participants comprised 361 031 survivors and 23 062 non-survivors.
As listed in table 1, the participants in the non-survival group were older and had greater social deprivation, BMI, DBP and SBP, BG, and triglycerides (p<0.05). The participants that were male, white and had a history of smoking, lower education level, or previous alcohol use had higher non-survival rates (p<0.05), as did those with MI, ischaemic stroke or haemorrhagic stroke (p<0.05).
Comparison of the basic characteristics between the survival group (n=361 031) and non-survival group (n=23 062)
Associations between HDL-C/LDL-C, LDL-C and HDL-C, and different adverse events
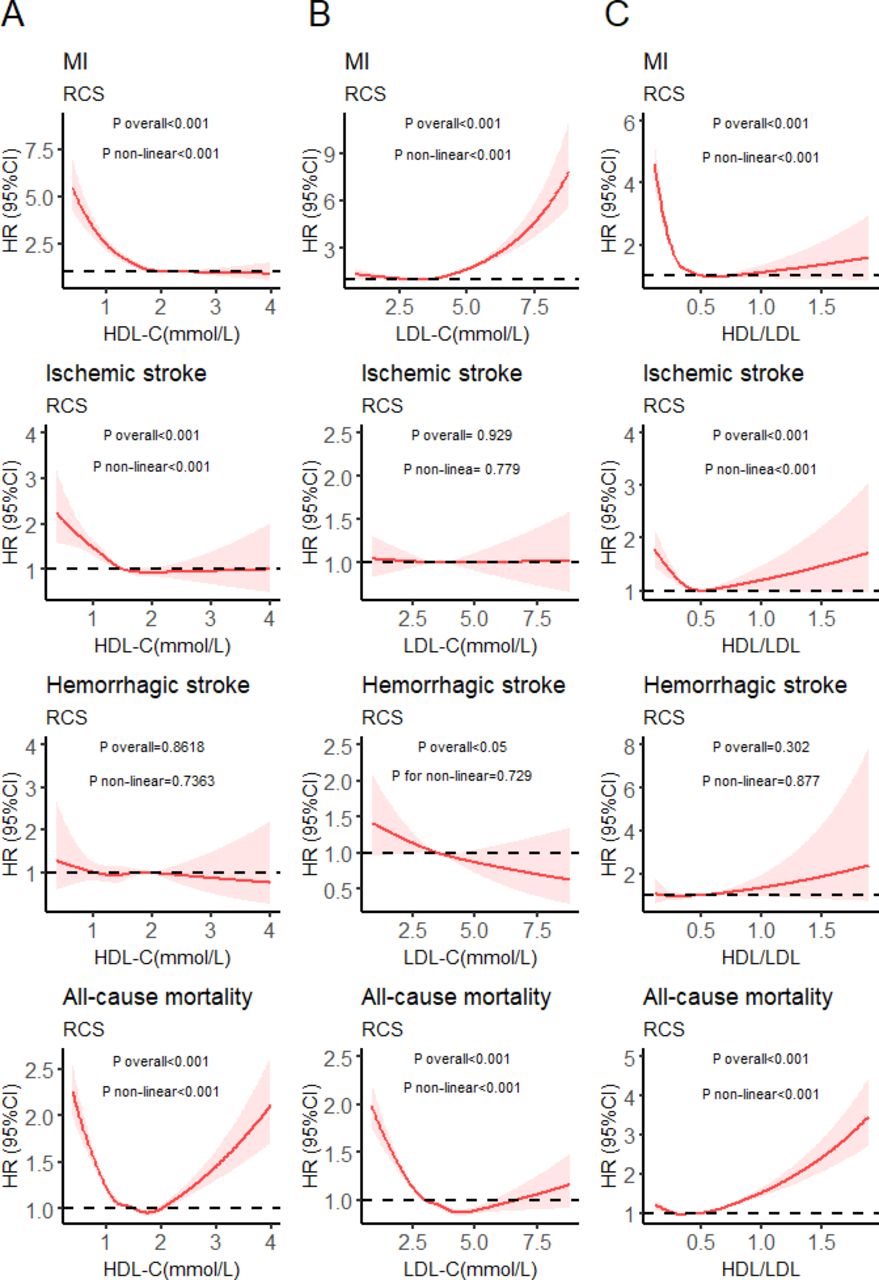
Figure 1A illustrates the non-linear correlation of HDL-C with MI and ischaemic stroke (non-linear p<0.05). Higher HDL-C concentrations significantly reduced the risks of MI and ischaemic stroke. However, a U-shaped relationship was observed between all-cause mortality and HDL-C (non-linear p<0.05), and HDL-C<1.74 mmol/L was correlated with the lowest all-cause mortality risk. Figure 1B illustrates a non-linear correlation between MI and LDL-C (non-linear p<0.05), with higher LDL-C concentrations significantly increasing the MI risk. A non-linear correlation was also observed between all-cause mortality and LDL-C (non-linear p<0.05). Figure 1C illustrates the non-linear correlation of HDL-C/LDL-C with MI and ischaemic stroke (non-linear p<0.05). A non-linear correlation was also observed between all-cause mortality and HDL-C/LDL-C (non-linear p<0.05), and extremely high HDL-C/LDL-C increased all-cause mortality risk.

Restricted cubic splines (RCS) for analysis of relationships between HDL-C (A), LDL-C (B), HDL-C/LDL-C (C) and different adverse events. (C) was adjusted for age, TDI, gender, race, smoking history, education level, alcohol use, BMI, BG, SBP, DBP and TG; (B) was adjusted for C+HDL C; a was adjusted for C+LDL. BG, blood glucose; DBP, diastolic blood pressure; HDL-C, high-density lipoprotein cholesterol; LDL-C, low-density lipoprotein cholesterol; MI, myocardial infarction; SBP, systolic blood pressure; TDI, Townsend Deprivation Index; TG, triglycerides.
Our results indicate that there were many non-linear correlations between LDL-C, HDL-C, and HDL/LDL-C, and different adverse events.
HR estimations for MI, all-cause mortality, haemorrhagic and ischaemic stroke among different HDL-C/LDL-C groups
Our results demonstrated significant correlations of HDL-C/LDL-C with multiple adverse events (figure 1C). Based on the RCS in figure 1C, we further divided the HDL-C/LDL-C ratios into three groups: <0.4 (n=1 41 411), 0.4–0.6 (n=1 93 228) and >0.6 (n=49 454).
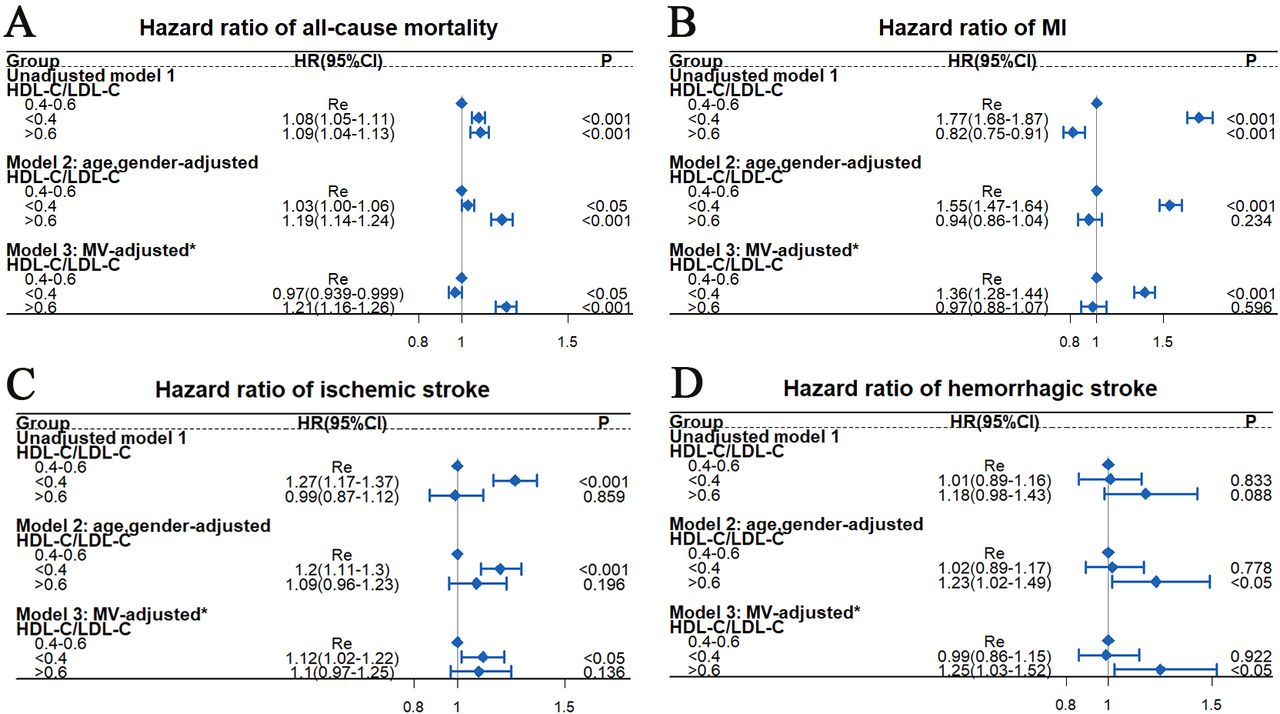
Figure 2 indicates that compared with HDL-C/LDL-C=0.4–0.6, HDL-C/LDL-C<0.4 and >0.6 were correlated with all-cause mortality after a full multivariable adjustment (HR=0.97 for HDL-C/LDL-C<0.4, 95% CI=0.939 to 0.999, p<0.05; HR=1.21 for HDL-C/LDL-C>0.6, 95% CI=1.16 to 1.26, p<0.001). HDL-C/LDL-C<0.4 was correlated with a higher risk of MI after full multivariable adjustment (HR=1.36, 95% CI=1.28 to 1.44, p<0.05), and also with a higher ischaemic stroke risk after full multivariable adjustment (HR=1.12, 95% CI=1.02 to 1.22, p<0.05). HDL-C/LDL-C>0.6 was correlated with a higher haemorrhagic stroke risk after full multivariable adjustment (HR=1.25, 95% CI=1.03 to 1.52, p<0.05).

HRs estimation for all-cause mortality (A), MI (B), ischaemic stroke (C) and haemorrhagic stroke (D) among different HDL-C/LDL-C groups by Cox proportional risk model. *Variables used for adjustment included TDI, age, gender, race, smoking history, alcohol use, education level, BMI, BG, SBP, DBP and TG. BG, blood glucose; BMI, body mass index; DBP, diastolic blood pressure; HDL-C, high-density lipoprotein cholesterol; LDL-C, low-density lipoprotein cholesterol; MI, myocardial infarction; MV, multivariable; SBP, systolic blood pressure; TDI, Townsend Deprivation Index; TG, triglycerides.
We further performed a subgroup analysis according to ages and gender. As listed in table 2, there were some new findings when comparing the subgroup analysis results in figure 2. Compared with each corresponding reference group (HDL-C/LDL-C=0.4–0.6), participants with HDL-C/LDL-C<0.4 who were male or younger than 60 years had a lower all-cause mortality risk (p<0.05), those with HDL-C/LDL-C<0.4 who were male or aged 60 years or older had a higher ischaemic stroke risk (p<0.05), and those with HDL-C/LDL-C>0.6 who were younger than 60 years old were correlated with a higher haemorrhagic stroke risk (HR=1.42, 95% CI=1.03 to 1.94, p<0.05) after full multivariable adjustment.
HRs estimation for myocardial infarction, all-cause mortality and haemorrhagic and ischaemic stroke among different HDL-C/LDL-C groups by subgroup analyses of age-disaggregated and gender-disaggregated analyses
Our results demonstrated that compared with HDL-C/LDL-C=0.4–0.6, HDL-C/LDL-C>0.6 was correlated with a higher risk of all-cause mortality for all participants and a higher haemorrhagic stroke risk for those younger than 60 years, and HDL-C/LDL-C<0.4 was correlated with a higher MI risk for all participants and a higher ischaemic stroke risk for those who were male or 60 years or older.
Joint association of HDL-C/LDL-C and CHD-GRS with MI risk
Both behavioural and genetic factors contribute to MI development.19 We further investigated whether appropriate HDL-C/LDL-C ratios could offset the risk of genetic susceptibility to MI. No statistically significant interaction was identified between CHD-GRS and HDL-C/LDL-C for the MI risk (p for interaction >0.05). Figure 3A indicates that compared with low CHD-GRS and HDL-C/LDL-C=0.4–0.6, participants with a combination of high CHD-GRS and HDL-C/LDL-C<0.4 were associated with the highest MI risk (HR=2.45, 95% CI=2.15 to 2.8, p<0.001). Figure 3B,C also suggests that participants with HDL-C/LDL-C<0.4 were correlated with a higher MI risk regardless of whether they had a high, intermediate or low CHD-GRS.

Joint correlation between CHD-GRS and HDL-C/LDL-C for myocardial infarction risk analysed using Cox proportional risk model. The multivariable model was adjusted for TDI, age, gender, race, smoking history, alcohol use, education level, BMI, BG, SBP, DBP and TG. BG, blood glucose; BMI, body mass index; CHD-GRS, coronary heart disease Genetic Risk Score; DBP, diastolic blood pressure; HDL-C, high-density lipoprotein cholesterol; LDL-C, low-density lipoprotein cholesterol; MI, myocardial infarction; SBP, systolic blood pressure; TDI, Townsend Deprivation Index; TG, triglycerides.
Discussion
In this large study of 384 093 participants with data spanning an average of >10 years, we obtained the following findings: (1) a non-linear association was observed between HDL-C/LDL-C and MI, all-cause mortality and ischaemic stroke; (2) compared with HDL-C/LDL-C=0.4–0.6, HDL-C/LDL-C<0.4 was correlated with a higher MI risk for all participants and a higher ischaemic stroke risk for those who were male or 60 years and older, and HDL-C/LDL-C>0.6 was correlated with a higher risk of all-cause mortality for all participants and a higher haemorrhagic stroke risk for those younger than 60 years, and (3) participants with a combination of high CHD-GRS and HDL-C/LDL-C<0.4 was correlated with the highest MI risk. Participants with HDL-C/LDL-C<0.4 were correlated with a higher MI risk regardless of whether they had a high, intermediate or low CHD-GRS.
HDL-C exerts various pleiotropic effects on atherosclerosis,20 and its ability to promote reverse cholesterol transport has been considered by most studies to be the key to its atherosclerotic protection.21 22 A U-shaped correlation was observed between mortality and HDL-C in two largest published studies,23 24 which was consistent with our findings (figure 1A). CVD risk has been shown to be reduced with lower levels of LDL-C,25 but more recent large studies have shown that there was a correlation between enhanced all-cause mortality and extremely low LDL-C,26 which was consistent with our findings (figure 1B). Therefore, there is a relationship between all-cause mortality and both LDL-C and HDL-C.
HDL-C/LDL-C can better reflect the balance of atherogenic and antiatherogenic cholesterol than HDL-C or LDL-C alone. Recent studies showed that the HDL-C/LDL-C ratio has a better predictive value for cardiovascular and cerebrovascular diseases than considering single lipoproteins.27 28 Regarding possible mechanisms of how an excessively low HDL-C/LDL-C ratio contributes to higher risk of ischaemic stroke and MI, a lower HDL-C/LDL-C ratio is considered a predictor of plaque vulnerability and coronary fatty plaque,29 while rupture of a high-risk vulnerable plaque is the main arterial thrombosis pathway that is related to ischaemic cardiovascular events.30–32 Age is another important risk factor for ischaemic stroke, and studies showed that the age-adjusted stroke incidence was higher in men than in women.33 Therefore, an excessively low HDL-C/LDL-C ratio is likely to relate to a higher ischaemic stroke risk in male and older participants.
Reverse causality may be a possible mechanism by which an excessively high HDL-C/LDL-C ratio relates to a higher all-cause mortality. Weakness and disease can cause cholesterol levels to decrease,34 and an excessively low level of LDL-C is correlated with a higher risk of all-cause mortality.26 However, excessively high level of HDL-C is also found to be correlated with a higher all-cause mortality with unclear mechanism.23 In our study, we found a correlation between excessively high level of HDL-C and a lower MI risk. The correlation between an excessively high HDL-C/LDL-C ratio and a higher risk of all-cause mortality may therefore be an indirect manifestation due to an increase in HDL or a decrease in LDL-C. However, the potential causal correlation between mortality and HDL-C/LDL-C needs to be further explored.
Systematic reviews and meta-analyses showed a relationship between a higher level of LDL-C and a lower risk of haemorrhagic stroke,35 and a positive relationship between HDL-C level and cerebral haemorrhage risk.36 Maintaining an appropriate cholesterol concentration is crucial for preventing small blood vessel rupture and remaining their integrity,37 and extremely high level of HDL-C and low level of LDL-C were strongly correlated with more microbleeds in the brain,38 a well-known haemorrhagic stroke risk factor. More potential mechanisms need to be explored in the future.
Genetic and environmental factors both contribute to MI development.9 A better understanding of the impact of genetic disease predictors requires applying genetic determinants to conditions of known environmental risk factors, and the same environmental factors may contribute differently to disease risk in populations with different genetic risks.39 This is the first study on the relationships between GRS and HDL-C/LDL-C on MI events. We found that participants with a combination of high CHD-GRS and HDL-C/LDL-C<0.4 were correlated with the highest MI risk. Participants with HDL-C/LDL-C<0.4 were correlated with a higher MI risk regardless of whether they had a high, intermediate or low CHD-GRS. In addition, since HDL-C/LDL-C>0.6 is related to an increased risk of all-cause mortality, HDL-C/LDL-C=0.4–0.6 may be the most appropriate range for reducing the CVD (MI, ischaemic stroke or haemorrhagic stroke) risk without increasing the all-cause mortality risk.
According to the European Society of Cardiology, the target level of LDL-C is currently <1.8 mmol/L in patients with very high CVD risks, <2.6 mmol/L in those with high risks and<3.0 mmol/L in those with low to moderate risks,40 however, the increased long-term risk of all-cause mortality correlated with an extremely low level of LDL-C has not been paid much attention to. LDL-C and HDL-C are correlated with multiple adverse events, and our study has combined LDL-C and HDL-C, and therefore, may have better public health implications for the primary prevention of cardiovascular events without increasing all-cause mortality risk.
Our study had some specific strengths. First, it had a large sample of more than 384 093 participants and used consistent methods to collect detailed demographic and lifestyle information, and medical history. Second, HDL-C/LDL-C can better reflect the balance of antiatherogenic and atherogenic cholesterol than LDL-C or HDL-C alone. Our study has combined both LDL-C and HDL-C to explore their influences on the risks of multiple adverse events, and we proposed an appropriate HDL-C/ LDL-C range (0.4–0.6). Finally, our study was novel in being the first to link genetic and environmental factors (HDL-C/LDL-C) with MI in a large population.
However, there were some limitations to our study. First, there were unknown confounding factors included in our model. Second, as an observational study, it cannot effectively assess the causal relationships between HDL-C/LDL-C and various adverse events. Future studies should use Mendelian randomisation and other research methods, although the results of our study still provide reference data for use in reducing LDL-C. Third, although our study is a large population study, the clinical significance and impact of HDL-C/LDL-C still need to be further verified in future studies. Finally, the results were mostly for European populations, which limits their generalisability to other populations, but it still has some reference value.
Conclusions
In UKB participants, HDL-C/LDL-C ratio of 0.4–0.6 was correlated with a lower risk of MI, all-cause mortality, and haemorrhagic and ischaemic stroke. In addition, participants with HDL-C/LDL-C<0.4 were correlated with a higher MI risk, regardless of whether they had a low, intermediate or high CHD-GRS. The clinical significance and impact of HDL-C/LDL-C need to be further verified in future studies.
Data availability statement
Data are available in a public, open access repository. Data are available on reasonable request and with the permission of the UK Biobank.
Ethics statements
Patient consent for publication
Acknowledgments
Special thanks to the UK Biobank participants, members of the research and investigation team, and the project development and management team.
References
Supplementary material
Supplementary Data
This web only file has been produced by the BMJ Publishing Group from an electronic file supplied by the author(s) and has not been edited for content.
Footnotes
SY and XH are joint first authors.
SY and XH contributed equally.
Contributors JL and AX conceptualised the research aims. SY, DH, TH, RY, SY, XH and MP participated in data analysis and interpretation. SY wrote the first draft of the paper and the other authors provided comments and approved the final manuscript. JL is responsible for the overall content as the guarantor and accepts full responsibility for the finished work and/or the conduct of the study, had access to the data, and controlled the decision to publish.
Competing interests None declared.
Provenance and peer review Not commissioned; externally peer reviewed.
Supplemental material This content has been supplied by the author(s). It has not been vetted by BMJ Publishing Group Limited (BMJ) and may not have been peer-reviewed. Any opinions or recommendations discussed are solely those of the author(s) and are not endorsed by BMJ. BMJ disclaims all liability and responsibility arising from any reliance placed on the content. Where the content includes any translated material, BMJ does not warrant the accuracy and reliability of the translations (including but not limited to local regulations, clinical guidelines, terminology, drug names and drug dosages), and is not responsible for any error and/or omissions arising from translation and adaptation or otherwise.